# Technical Document Extraction: ORM Versus PRM Performance Analysis
## 1. Document Metadata
* **Title:** ORM Versus PRM
* **Language:** English
* **Image Type:** Line graph with shaded confidence intervals/error bands
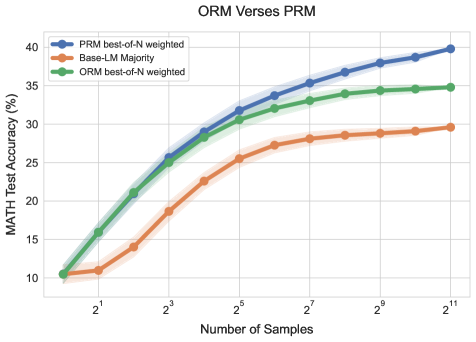
* **Primary Subject:** Comparison of MATH Test Accuracy across different sampling methods and reward models
## 2. Component Isolation
### A. Header
* **Main Title:** ORM Versus PRM
### B. Main Chart Area
* **Y-Axis Label:** MATH Test Accuracy (%)
* **Y-Axis Scale:** Linear, ranging from 10 to 40 with increments of 5
* **X-Axis Label:** Number of Samples
* **X-Axis Scale:** Logarithmic (Base 2), with markers at $2^1, 2^3, 2^5, 2^7, 2^9, 2^{11}$
* **Legend Location:** Top-left quadrant
### C. Legend Data
| Color | Label |
| :--- | :--- |
| **Blue** | PRM best-of-N weighted |
| **Orange** | Base-LM Majority |
| **Green** | ORM best-of-N weighted |
---
## 3. Trend Verification and Data Extraction
### Series 1: PRM best-of-N weighted (Blue Line)
* **Visual Trend:** This series shows the highest overall performance. It follows a steep upward trajectory from $2^0$ to $2^5$, after which the slope decreases but remains consistently positive, ending at the highest point on the graph.
* **Estimated Data Points:**
* $2^0$ (1 sample): ~10.5%
* $2^3$ (8 samples): ~25.5%
* $2^5$ (32 samples): ~31.8%
* $2^7$ (128 samples): ~35.3%
* $2^{11}$ (2048 samples): ~39.8%
### Series 2: ORM best-of-N weighted (Green Line)
* **Visual Trend:** Initially tracks very closely with the PRM (Blue) line for low sample counts ($2^0$ to $2^3$). However, after $2^3$, the growth rate slows down significantly compared to PRM, eventually plateauing between $2^9$ and $2^{11}$.
* **Estimated Data Points:**
* $2^0$ (1 sample): ~10.5%
* $2^3$ (8 samples): ~25.0%
* $2^5$ (32 samples): ~30.5%
* $2^7$ (128 samples): ~33.0%
* $2^{11}$ (2048 samples): ~34.8%
### Series 3: Base-LM Majority (Orange Line)
* **Visual Trend:** This is the baseline series and performs the worst of the three. It shows a steady but much shallower upward slope. It lacks the initial "burst" of accuracy seen in the reward-model-guided series.
* **Estimated Data Points:**
* $2^0$ (1 sample): ~10.5%
* $2^3$ (8 samples): ~18.5%
* $2^5$ (32 samples): ~25.5%
* $2^7$ (128 samples): ~28.1%
* $2^{11}$ (2048 samples): ~29.6%
---
## 4. Key Findings and Observations
1. **Convergence at Origin:** All three methods start at approximately the same accuracy (~10.5%) when the number of samples is 1 ($2^0$).
2. **PRM Superiority:** The Process Reward Model (PRM) weighted best-of-N consistently outperforms the Outcome Reward Model (ORM) and the Base-LM Majority vote as the number of samples increases.
3. **Scaling Efficiency:** Both ORM and PRM provide a significant "boost" over simple majority voting. However, the PRM scales better with more samples, whereas the ORM shows signs of diminishing returns (plateauing) earlier.
4. **Statistical Variance:** Shaded regions around each line indicate confidence intervals. The variance appears relatively stable across the sample sizes, with no significant widening or narrowing as $N$ increases.