## Diagram: REASON Algorithm Optimization
### Overview
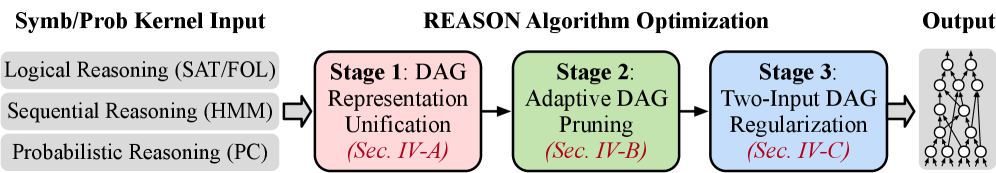
The image is a flowchart illustrating the REASON Algorithm Optimization process. It shows the input, three stages of the algorithm, and the output.
### Components/Axes
* **Header:**
* "Symb/Prob Kernel Input" (top-left)
* "REASON Algorithm Optimization" (top-center)
* "Output" (top-right)
* **Input:**
* A gray box containing:
* "Logical Reasoning (SAT/FOL)"
* "Sequential Reasoning (HMM)"
* "Probabilistic Reasoning (PC)"
* **Stages:**
* Stage 1: A rounded-corner red box labeled "Stage 1: DAG Representation Unification (Sec. IV-A)"
* Stage 2: A rounded-corner green box labeled "Stage 2: Adaptive DAG Pruning (Sec. IV-B)"
* Stage 3: A rounded-corner blue box labeled "Stage 3: Two-Input DAG Regularization (Sec. IV-C)"
* **Flow:** Arrows indicate the flow from input to Stage 1, Stage 1 to Stage 2, Stage 2 to Stage 3, and Stage 3 to output.
* **Output:** A gray box containing a diagram of a directed acyclic graph (DAG).
### Detailed Analysis or Content Details
* **Input:** The input consists of three types of reasoning: Logical, Sequential, and Probabilistic. The abbreviations in parentheses (SAT/FOL, HMM, PC) likely refer to specific methods or formalisms used for each type of reasoning.
* **Stage 1:** DAG Representation Unification: This stage likely involves converting the input into a unified Directed Acyclic Graph (DAG) representation. The reference "(Sec. IV-A)" suggests that more details can be found in Section IV-A of a related document.
* **Stage 2:** Adaptive DAG Pruning: This stage likely involves pruning or simplifying the DAG based on some adaptive criteria. The reference "(Sec. IV-B)" suggests that more details can be found in Section IV-B of a related document.
* **Stage 3:** Two-Input DAG Regularization: This stage likely involves regularizing the DAG to have two inputs per node. The reference "(Sec. IV-C)" suggests that more details can be found in Section IV-C of a related document.
* **Output:** The output is a DAG, visually represented as a network of nodes (circles) and directed edges (arrows).
### Key Observations
* The diagram presents a sequential process, with each stage building upon the previous one.
* The use of DAGs is central to the algorithm, as indicated by its presence in all three stages.
* The references to sections IV-A, IV-B, and IV-C suggest that this diagram is part of a larger document that provides more detailed explanations of each stage.
### Interpretation
The diagram illustrates the REASON Algorithm Optimization process, which takes symbolic and probabilistic reasoning inputs and transforms them into an optimized DAG representation through three key stages: DAG Representation Unification, Adaptive DAG Pruning, and Two-Input DAG Regularization. The algorithm aims to create a structured and simplified DAG that can be used for further processing or analysis. The use of specific techniques like SAT/FOL, HMM, and PC for the input reasoning types suggests that the algorithm is designed to handle a variety of reasoning tasks.