## Line Chart: Benchmark: OlympiadBench
### Overview
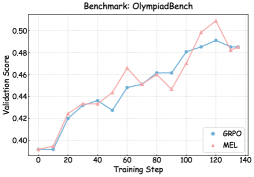
The image displays a line chart comparing the validation score performance of two models, GRPO and MEL, over the course of training steps on the "OlympiadBench" benchmark. The chart tracks performance from step 0 to step 140.
### Components/Axes
* **Chart Title:** "Benchmark: OlympiadBench" (centered at the top).
* **X-Axis:** Labeled "Training Step". The axis has major tick marks at intervals of 20, labeled: 0, 20, 40, 60, 80, 100, 120, 140.
* **Y-Axis:** Labeled "Validation Score". The axis has major tick marks at intervals of 0.02, labeled: 0.40, 0.42, 0.44, 0.46, 0.48, 0.50.
* **Legend:** Located in the bottom-right corner of the chart area. It contains two entries:
* A blue line with circle markers labeled "GRPO".
* A red line with triangle markers labeled "MEL".
### Detailed Analysis
**Data Series 1: GRPO (Blue line, circle markers)**
* **Trend:** Shows a generally steady, upward trend with minor fluctuations. It starts low, rises sharply initially, then continues a more gradual ascent with a notable dip around step 60.
* **Approximate Data Points:**
* Step 0: ~0.395
* Step 20: ~0.425
* Step 40: ~0.435
* Step 60: ~0.428 (dip)
* Step 80: ~0.455
* Step 100: ~0.460
* Step 120: ~0.490 (peak)
* Step 140: ~0.485
**Data Series 2: MEL (Red line, triangle markers)**
* **Trend:** Shows a more volatile upward trend compared to GRPO. It follows a similar initial rise but exhibits larger swings, including a significant peak and subsequent drop in the later stages.
* **Approximate Data Points:**
* Step 0: ~0.395
* Step 20: ~0.425
* Step 40: ~0.435
* Step 60: ~0.465 (local peak)
* Step 80: ~0.455
* Step 100: ~0.480
* Step 120: ~0.505 (global peak)
* Step 140: ~0.485 (sharp drop)
### Key Observations
1. **Convergent Start:** Both models begin at nearly identical validation scores (~0.395) at step 0.
2. **Parallel Early Growth:** The models perform almost identically from step 0 to step 40.
3. **Divergence and Volatility:** After step 40, the MEL model's performance becomes more volatile, showing a higher peak at step 60 while GRPO dips. MEL also achieves a significantly higher maximum score (~0.505 vs. ~0.490).
4. **Late-Stage Convergence:** Despite different paths, both models converge to nearly the same final score (~0.485) at step 140.
5. **Overall Improvement:** Both models demonstrate clear learning, improving their validation scores by approximately 0.09 points over 140 training steps.
### Interpretation
The chart suggests that on the OlympiadBench benchmark, both the GRPO and MEL training methods are effective, leading to substantial performance gains over 140 steps. The key difference lies in their learning dynamics.
* **GRPO** exhibits a more stable and predictable learning trajectory. Its steady climb, barring one minor dip, indicates robust and consistent optimization. This could be preferable in scenarios where training stability and predictable outcomes are critical.
* **MEL** demonstrates a more aggressive or exploratory learning pattern. Its higher volatility, marked by larger peaks and troughs, suggests it may be navigating a more complex loss landscape or employing a higher learning rate. While it reaches a higher peak performance, this comes with less stability, as evidenced by the sharp drop after step 120. This might indicate potential overfitting at that peak or sensitivity to later training phases.
The final convergence at step 140 is intriguing. It implies that despite different intermediate behaviors, both methods may be approaching a similar performance ceiling for this specific model architecture and benchmark. The choice between them would depend on the priority: stable, reliable progress (favoring GRPO) versus the potential for higher peak performance at the cost of stability (favoring MEL, with careful monitoring).