## Line Chart: Benchmark: OlympiadBench
### Overview
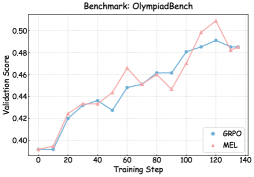
The chart compares the validation performance of two models, GRPO and MEL, across training steps on the OlympiadBench benchmark. Both models show increasing validation scores over time, with GRPO consistently outperforming MEL after ~60 training steps.
### Components/Axes
- **X-axis**: Training Step (0 to 140, increments of 20)
- **Y-axis**: Validation Score (0.40 to 0.50, increments of 0.02)
- **Legend**:
- Blue line: GRPO
- Red line: MEL
- **Title**: "Benchmark: OlympiadBench" (top center)
### Detailed Analysis
1. **GRPO (Blue Line)**:
- Starts at ~0.40 validation score at step 0.
- Sharp rise to ~0.43 by step 20.
- Gradual increase to ~0.46 by step 60.
- Steeper ascent to peak at ~0.49 by step 120.
- Slight decline to ~0.48 by step 140.
- Key inflection: Crosses MEL line at ~step 60.
2. **MEL (Red Line)**:
- Starts at ~0.40 validation score at step 0.
- Slower rise to ~0.43 by step 20.
- Gradual increase to ~0.46 by step 60.
- Sharp peak at ~0.50 by step 120.
- Steep decline to ~0.48 by step 140.
- Key inflection: Crossed by GRPO at ~step 60.
### Key Observations
- **Performance Divergence**: GRPO surpasses MEL after ~60 steps, maintaining a ~0.02 advantage by step 140.
- **Volatility**: MEL exhibits sharper fluctuations (e.g., steep drop post-step 120), while GRPO shows smoother progression.
- **Convergence**: Both models plateau near ~0.48–0.49 validation score by step 140.
### Interpretation
The data suggests GRPO is more effective for this benchmark, likely due to superior optimization or architectural advantages. The MEL model’s post-120-step decline may indicate overfitting or instability. The initial dip in GRPO’s performance (~step 40) could reflect temporary training instability, but its recovery aligns with sustained improvement. The convergence at higher steps implies both models reach practical limits, but GRPO’s stability makes it preferable for deployment.