## Diagram: Rule Identification Networks with Symbolic Representation
### Overview
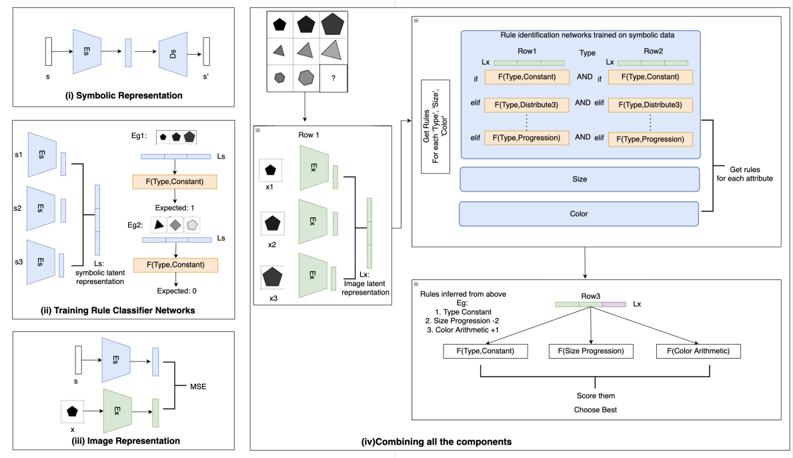
This diagram illustrates a process for identifying rules from image data, combining symbolic representation with rule classifier networks. The diagram is divided into four main sections: (i) Symbolic Representation, (ii) Training Rule Classifier Networks, (iii) Image Representation, and (iv) Combining all the components. It depicts a flow of information from initial image input to rule inference and scoring.
### Components/Axes
The diagram consists of several interconnected blocks representing different stages of the process. Key components include:
* **Input Images (s, s1, s2, s3):** Represent initial image inputs.
* **Symbolic Representation (Ls):** Represents the symbolic output of the image processing.
* **Rule Classifier Networks:** Networks trained to identify rules based on symbolic data.
* **Image Latent Representation (Lx):** Represents the learned representation of the image.
* **MSE (Mean Squared Error):** Used for evaluating the image representation.
* **Rule Identification Networks:** Networks trained on symbolic data to identify rules.
* **Rows 1, 2, 3:** Represent different stages of rule inference and scoring.
* **Attributes (Type, Size, Color):** Represent the attributes used for rule identification.
* **Functions (F(Type, Constant), F(Size, Progression), F(Color, Arithmetic)):** Represent the functions used to define rules.
### Detailed Analysis or Content Details
**(i) Symbolic Representation:**
* An input image 's' is processed through a series of blocks (represented by rectangles with arrows) resulting in a symbolic representation 's''.
* A grid of pentagonal shapes is shown, representing the symbolic output. The grid contains a mix of filled and unfilled pentagons.
**(ii) Training Rule Classifier Networks:**
* Three input images (s1, s2, s3) are processed.
* Each image is associated with an expected symbolic representation (Eg1, Eg2, Eg3) and a loss function (Ls).
* Eg1 and Eg2 show a grid of filled pentagons. Eg3 shows a grid of unfilled pentagons.
* The loss function Ls is associated with F(Type, Constant).
**(iii) Image Representation:**
* An input image is processed through a series of blocks, resulting in an image representation.
* The image representation is compared to the expected symbolic representation using MSE.
* The output is a grid of pentagonal shapes.
**(iv) Combining all the components:**
* **Rule Identification Networks:** A table is shown with "Type", "Size", and "Color" as attributes. The table contains conditional statements (if/elif) using functions like F(Type, Constant), F(Type, Distribute), and F(Type, Progression).
| Attribute | Function Example |
|---|---|
| Type | F(Type, Constant) |
| Size | F(Size, Progression) |
| Color | F(Color, Arithmetic) |
* **Rules Inferred from above:** Three rules are listed:
1. Type Constant
2. Size Progression - 2
3. Color Arithmetic + 1
* **Row X3:** Contains F(Type, Constant), F(Size, Progression), and F(Color, Arithmetic).
* A scoring mechanism is indicated, with the goal of choosing the best rule.
### Key Observations
* The diagram emphasizes the integration of symbolic representation with neural networks for rule identification.
* The use of MSE suggests a learning process where the image representation is refined to match the expected symbolic output.
* The rule identification networks appear to operate based on conditional logic, considering attributes like type, size, and color.
* The scoring mechanism indicates a process for selecting the most appropriate rule based on the inferred rules.
### Interpretation
The diagram presents a system for extracting and representing rules from visual data. The process begins with converting images into symbolic representations, which are then used to train rule classifier networks. These networks learn to identify rules based on attributes like type, size, and color. The system then infers rules from new images and scores them to determine the best match. This approach could be used for tasks such as object recognition, scene understanding, or automated reasoning. The use of MSE suggests a supervised learning approach, where the system is trained on labeled data. The combination of symbolic representation and neural networks allows the system to leverage both the interpretability of symbolic logic and the learning capabilities of neural networks. The diagram suggests a complex system with multiple stages of processing and learning, designed to extract meaningful rules from visual data. The diagram does not provide any numerical data, but rather illustrates a conceptual framework.