## Loss and Accuracy Curve: Learning to Solve and Adapt
### Overview
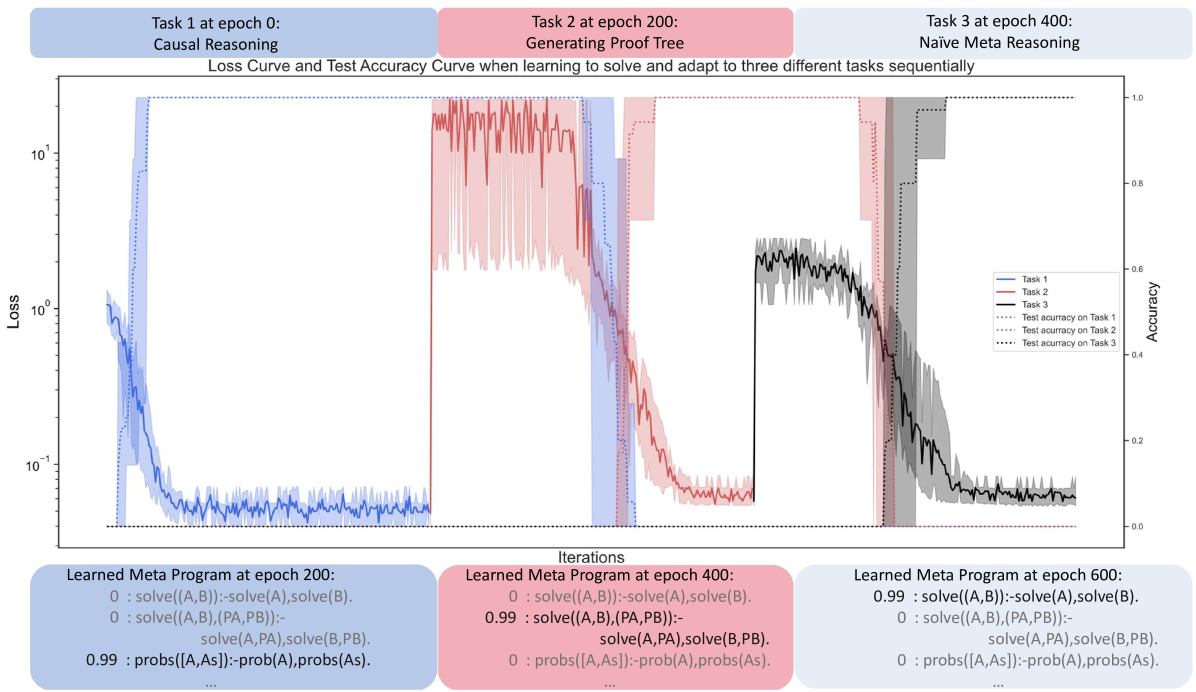
The image presents a line chart illustrating the loss and test accuracy curves of a model learning to solve and adapt to three different tasks sequentially. The chart displays the loss on a logarithmic scale on the left y-axis and accuracy on a linear scale on the right y-axis, plotted against iterations on the x-axis. The chart is segmented into three distinct phases, each corresponding to a different task. The tasks are: Task 1 (Causal Reasoning), Task 2 (Generating Proof Tree), and Task 3 (Naive Meta Reasoning). The chart also includes learned meta programs at epochs 200, 400, and 600.
### Components/Axes
* **Title:** Loss Curve and Test Accuracy Curve when learning to solve and adapt to three different tasks sequentially
* **X-axis:** Iterations
* **Left Y-axis:** Loss (logarithmic scale)
* Axis markers: 10^-1, 10^0, 10^1
* **Right Y-axis:** Accuracy (linear scale)
* Axis markers: 0.0, 0.2, 0.4, 0.6, 0.8, 1.0
* **Legend:** Located on the right side of the chart.
* Task 1 (Blue solid line)
* Task 2 (Red solid line)
* Task 3 (Black solid line)
* Test accuracy on Task 1 (Blue dotted line)
* Test accuracy on Task 2 (Red dotted line)
* Test accuracy on Task 3 (Black dotted line)
* **Task Labels:**
* Task 1 at epoch 0: Causal Reasoning (Top-left, light blue background)
* Task 2 at epoch 200: Generating Proof Tree (Top-center, light red background)
* Task 3 at epoch 400: Naive Meta Reasoning (Top-right, light grey background)
* **Learned Meta Program Blocks:**
* Learned Meta Program at epoch 200 (Bottom-left, light blue background)
* Learned Meta Program at epoch 400 (Bottom-center, light red background)
* Learned Meta Program at epoch 600 (Bottom-right, light grey background)
### Detailed Analysis
* **Task 1 (Blue):**
* **Loss (Blue solid line):** Starts at approximately 10^1, decreases rapidly to around 10^-1 within the first ~50 iterations, and then stabilizes around 10^-1.
* **Test Accuracy (Blue dotted line):** Starts near 0.0, increases rapidly to approximately 1.0 within the first ~50 iterations, and then remains stable at 1.0.
* **Task 2 (Red):**
* **Loss (Red solid line):** Starts at approximately 10^1, decreases to around 10^-1 between iterations ~200 and ~300.
* **Test Accuracy (Red dotted line):** Starts near 0.0, increases to approximately 1.0 between iterations ~200 and ~300, and then remains stable at 1.0.
* **Task 3 (Black):**
* **Loss (Black solid line):** Starts at approximately 0.6 (estimated log scale value), decreases to around 0.1 between iterations ~400 and ~500.
* **Test Accuracy (Black dotted line):** Starts near 0.0, increases to approximately 1.0 between iterations ~400 and ~500, and then remains stable at 1.0.
* **Learned Meta Programs:**
* **Epoch 200 (Blue):**
* `0 : solve((A,B)):-solve(A),solve(B).`
* `0 : solve((A,B),(PA,PB)):- solve(A,PA),solve(B,PB).`
* `0.99 : probs([A,As]):-prob(A),probs(As).`
* **Epoch 400 (Red):**
* `0 : solve((A,B)):-solve(A),solve(B).`
* `0.99 : solve((A,B),(PA,PB)):- solve(A,PA),solve(B,PB).`
* `0 : probs([A,As]):-prob(A),probs(As).`
* **Epoch 600 (Grey):**
* `0.99 : solve((A,B)):-solve(A),solve(B).`
* `0 : solve((A,B),(PA,PB)):- solve(A,PA),solve(B,PB).`
* `0 : probs([A,As]):-prob(A),probs(As).`
### Key Observations
* The loss decreases and test accuracy increases for each task as the model learns.
* The model adapts to each new task sequentially.
* The test accuracy for each task plateaus at approximately 1.0 after the initial learning phase.
* The learned meta programs evolve over time, reflecting the model's adaptation to the different tasks.
### Interpretation
The chart demonstrates the model's ability to learn and adapt to different tasks sequentially. The decreasing loss and increasing test accuracy indicate that the model is effectively learning to solve each task. The learned meta programs provide insights into the model's evolving understanding of the problem domain. The sequential nature of the learning process is evident in the distinct phases of the chart, each corresponding to a different task. The model appears to achieve high accuracy on each task after a relatively short learning period. The changes in the learned meta programs suggest that the model is refining its problem-solving strategies as it encounters new tasks.