TECHNICAL ASSET FINGERPRINT
aab706ea8db1c51470be5f17
Click to view fullscreen
Press ESC or click to close
FOUND IN PAPERS
EXPERT: healer-alpha-free VERSION 1
RUNTIME: free/openrouter/healer-alpha
INTEL_VERIFIED
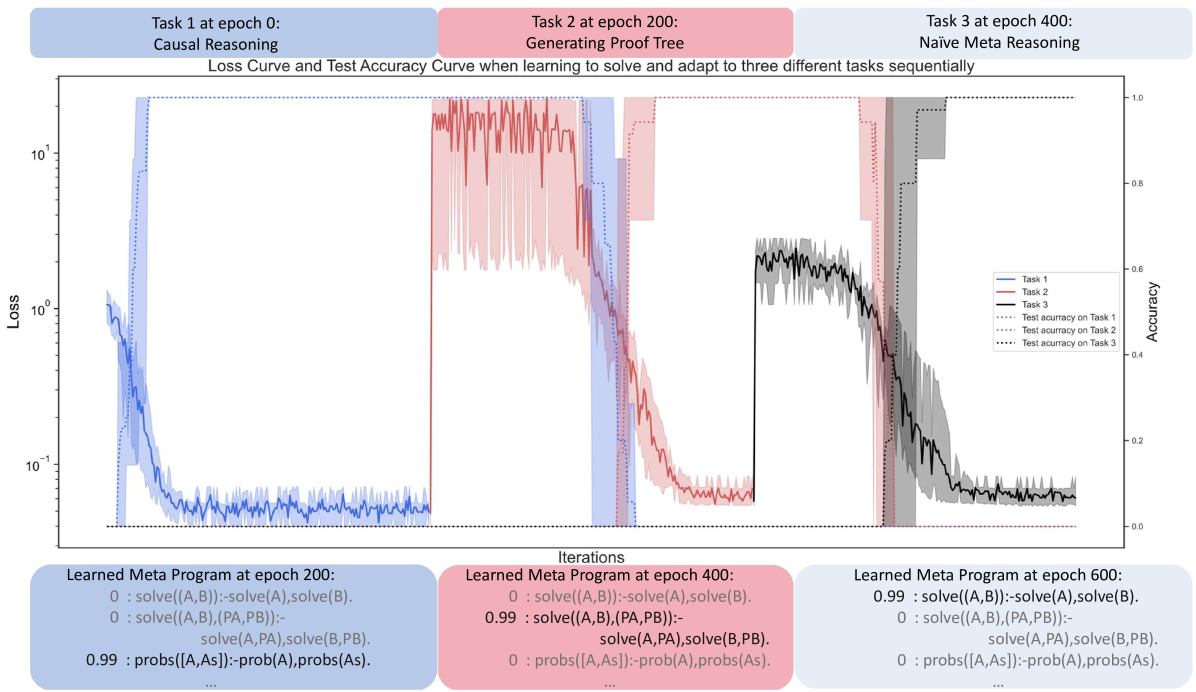
## [Chart]: Loss Curve and Test Accuracy Curve for Sequential Task Learning
### Overview
The image is a technical chart illustrating the training process of a machine learning model as it sequentially learns three distinct tasks. It displays both the loss (error) and test accuracy over training iterations (epochs). The chart is divided into three vertical segments, each corresponding to the training period for a specific task. Below the main chart, three text boxes show the state of a "Learned Meta Program" at different epochs.
### Components/Axes
**Header (Top):**
- Three colored boxes label the tasks and their starting epochs:
- **Blue Box (Left):** "Task 1 at epoch 0: Causal Reasoning"
- **Pink Box (Center):** "Task 2 at epoch 200: Generating Proof Tree"
- **Grey Box (Right):** "Task 3 at epoch 400: Naive Meta Reasoning"
- **Chart Title:** "Loss Curve and Test Accuracy Curve when learning to solve and adapt to three different tasks sequentially"
**Main Chart Axes:**
- **X-axis (Bottom):** Label: "Iterations". Scale: Linear, from 0 to approximately 600 epochs. Major ticks at 0, 200, 400, 600.
- **Primary Y-axis (Left):** Label: "Loss". Scale: Logarithmic, ranging from 10⁻¹ (0.1) to 10¹ (10).
- **Secondary Y-axis (Right):** Label: "Accuracy". Scale: Linear, from 0.0 to 1.0.
**Legend (Center-Right):**
- Positioned inside the chart area, slightly right of center.
- **Solid Lines (Loss):**
- Blue solid line: "Task 1"
- Red solid line: "Task 2"
- Black solid line: "Task 3"
- **Dotted Lines (Accuracy):**
- Blue dotted line: "Test accuracy on Task 1"
- Red dotted line: "Test accuracy on Task 2"
- Black dotted line: "Test accuracy on Task 3"
- **Shaded Areas:** Each solid loss line has a corresponding shaded area of the same color, representing variance or confidence intervals.
**Footer (Bottom):** Three text boxes showing "Learned Meta Program" states.
- **Blue Box (Left):** "Learned Meta Program at epoch 200:"
- `0 : solve((A,B)):-solve(A),solve(B).`
- `0 : solve((A,B),(PA,PB)):- solve(A,PA),solve(B,PB).`
- `0.99 : probs([A,As]):-prob(A),probs(As).`
- **Pink Box (Center):** "Learned Meta Program at epoch 400:"
- `0 : solve((A,B)):-solve(A),solve(B).`
- `0.99 : solve((A,B),(PA,PB)):- solve(A,PA),solve(B,PB).`
- `0 : probs([A,As]):-prob(A),probs(As).`
- **Grey Box (Right):** "Learned Meta Program at epoch 600:"
- `0.99 : solve((A,B)):-solve(A),solve(B).`
- `0 : solve((A,B),(PA,PB)):- solve(A,PA),solve(B,PB).`
- `0 : probs([A,As]):-prob(A),probs(As).`
### Detailed Analysis
**Task 1 (Causal Reasoning) - Epochs 0-200 (Blue Region):**
- **Loss Trend:** The blue loss line starts high (≈1.0) and rapidly decreases within the first ~50 epochs, stabilizing at a low value (≈0.05-0.08) for the remainder of the period. The trend is a steep downward slope followed by a flat plateau.
- **Accuracy Trend:** The blue dotted accuracy line starts near 0.0 and rises sharply to near 1.0 (≈0.98) concurrently with the loss drop, remaining stable thereafter.
**Task 2 (Generating Proof Tree) - Epochs 200-400 (Pink Region):**
- **Loss Trend:** At epoch 200, the red loss line spikes dramatically to a high value (≈5-10). It exhibits high volatility (large spikes) for about 50-70 epochs before beginning a steady decline, reaching a low value (≈0.06-0.1) by epoch 400. The trend is a sharp spike, followed by noisy decline, then stabilization.
- **Accuracy Trend:** The red dotted accuracy line drops to near 0.0 at epoch 200. It recovers slowly, showing a gradual upward trend, reaching approximately 0.9 by epoch 400.
**Task 3 (Naive Meta Reasoning) - Epochs 400-600 (Grey Region):**
- **Loss Trend:** At epoch 400, the black loss line spikes to a moderate level (≈0.5-0.7). It shows a clear downward trend with moderate noise, decreasing to a low value (≈0.06-0.08) by epoch 600.
- **Accuracy Trend:** The black dotted accuracy line drops to near 0.0 at epoch 400. It recovers with a steady upward slope, reaching approximately 0.95 by epoch 600.
**Meta Program Evolution:**
- **Epoch 200:** The program with confidence `0.99` is `probs([A,As]):-prob(A),probs(As).` The two `solve` rules have confidence `0`.
- **Epoch 400:** The program with confidence `0.99` is `solve((A,B),(PA,PB)):- solve(A,PA),solve(B,PB).` The other two rules have confidence `0`.
- **Epoch 600:** The program with confidence `0.99` is `solve((A,B)):-solve(A),solve(B).` The other two rules have confidence `0`.
### Key Observations
1. **Sequential Learning & Catastrophic Forgetting:** The model successfully learns each new task, as evidenced by decreasing loss and increasing accuracy within each task's dedicated training period. However, the sharp spikes in loss and drops in accuracy for subsequent tasks at their start epochs (200, 400) indicate the model's parameters are being significantly adjusted, potentially interfering with previously learned knowledge.
2. **Task Difficulty/Adaptation Speed:** Task 1 is learned fastest. Task 2 shows the most volatile loss and a slower accuracy recovery, suggesting it may be more complex or cause more interference. Task 3 shows a smoother adaptation than Task 2.
3. **Meta-Program Specialization:** The "Learned Meta Program" boxes show that the model's internal rule confidence shifts dramatically between tasks. At each major epoch milestone (200, 400, 600), a different logical rule becomes dominant (confidence 0.99), while the others are suppressed (confidence 0). This suggests the model is reconfiguring its core reasoning strategy for each new task.
### Interpretation
This chart demonstrates a model undergoing **sequential multi-task learning**. The primary narrative is one of adaptation and specialization. The model is not simply accumulating knowledge; it is actively reconfiguring its internal "meta-program" (a set of logical rules) to prioritize the strategy most effective for the current task.
The **Peircean investigative** reading suggests the model is abductively reasoning about the best problem-solving framework for each new challenge. The shift from a `probs`-based rule (Task 1: Causal Reasoning) to a structured `solve` with proof trees (Task 2) and finally to a simpler, compositional `solve` (Task 3: Naive Meta Reasoning) indicates the model is discovering and adopting different "hypotheses" (rules) about how to reason.
The **notable anomaly** is the extreme volatility in Task 2's loss. This could indicate that "Generating Proof Tree" is a fundamentally different or more difficult task for the model's architecture, causing instability during the adaptation phase. The fact that the model stabilizes and achieves high accuracy by the end of each phase shows its robustness, but the interference at task boundaries highlights a key challenge in continual learning systems: balancing plasticity (learning new things) with stability (retaining old things). The meta-program shifts provide a window into *how* the model achieves this balance—by essentially "switching gears" its core reasoning engine.
DECODING INTELLIGENCE...