## Line Chart: Loss and Test Accuracy Across Three Tasks
### Overview
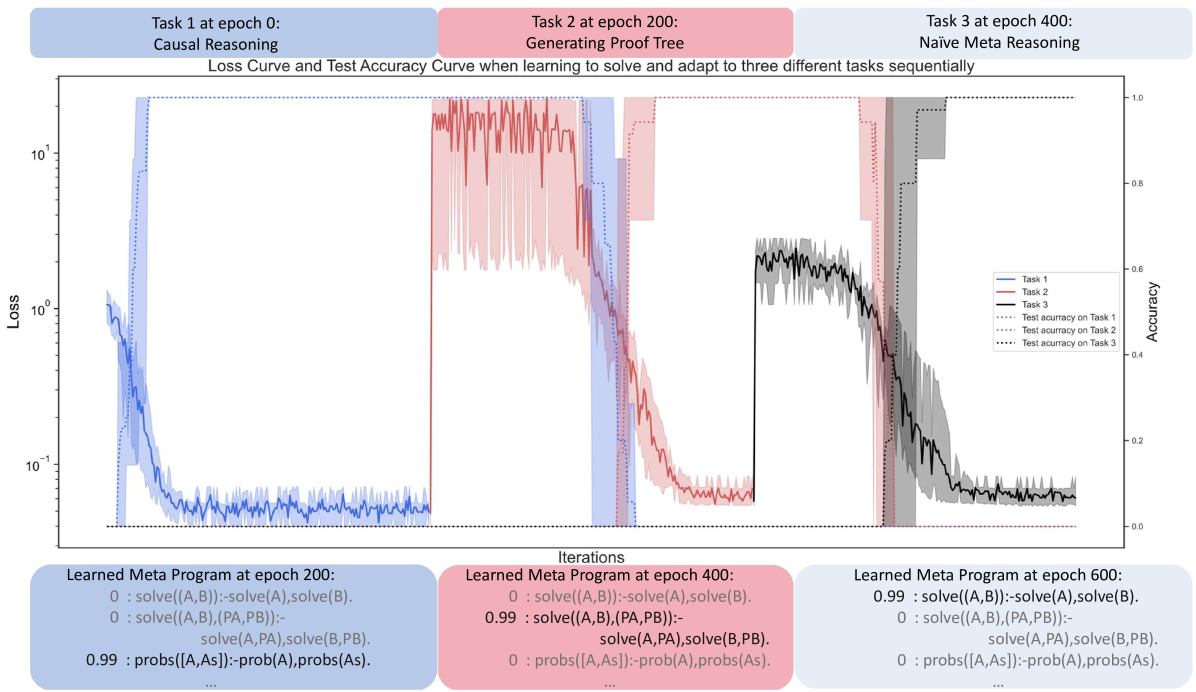
The chart visualizes the training progress of a meta-learning system across three sequential tasks (Causal Reasoning, Proof Tree Generation, Naïve Meta Reasoning) over 600 epochs. It shows loss curves (log scale) and test accuracy curves (linear scale) for each task, alongside learned meta-programs at key epochs.
---
### Components/Axes
- **X-axis**: Iterations (0 to 600), with vertical markers at epochs 0, 200, and 400.
- **Y-axis (Left)**: Loss (log scale, 10⁻¹ to 10¹).
- **Y-axis (Right)**: Test Accuracy (linear scale, 0.0 to 1.0).
- **Legend**:
- **Task 1** (blue): Causal Reasoning (solid line for loss, dotted line for accuracy).
- **Task 2** (red): Generating Proof Tree (solid line for loss, dotted line for accuracy).
- **Task 3** (black): Naïve Meta Reasoning (solid line for loss, dotted line for accuracy).
---
### Detailed Analysis
#### Task 1 (Causal Reasoning, Blue)
- **Loss**: Starts at ~10¹, drops sharply to ~10⁻¹ by epoch 50, then stabilizes with minor fluctuations.
- **Accuracy**: Rises from ~0.0 to ~0.8 by epoch 50, then plateaus.
- **Learned Meta-Program (Epoch 200)**:
```python
0 : solve((A,B)):-solve(A),solve(B).
0 : solve((A,B),(PA,PB)):-solve(A,PA),solve(B,PB).
0.99 : probs([A,As]):-prob(A),probs(As).
```
#### Task 2 (Proof Tree Generation, Red)
- **Loss**: Starts at ~10¹, drops sharply to ~10⁻¹ by epoch 250, then stabilizes.
- **Accuracy**: Rises from ~0.0 to ~0.8 by epoch 250, then plateaus.
- **Learned Meta-Program (Epoch 400)**:
```python
0 : solve((A,B)):-solve(A),solve(B).
0.99 : solve((A,B),(PA,PB)):-solve(A,PA),solve(B,PB).
0 : probs([A,As]):-prob(A),probs(As).
```
#### Task 3 (Naïve Meta Reasoning, Black)
- **Loss**: Starts at ~10¹, drops sharply to ~10⁻¹ by epoch 450, then stabilizes.
- **Accuracy**: Rises from ~0.0 to ~0.8 by epoch 450, then plateaus.
- **Learned Meta-Program (Epoch 600)**:
```python
0.99 : solve((A,B)):-solve(A),solve(B).
0 : solve((A,B),(PA,PB)):-solve(A,PA),solve(B,PB).
0 : probs([A,As]):-prob(A),probs(As).
```
---
### Key Observations
1. **Loss Reduction**: All tasks show rapid loss reduction (~10¹ → 10⁻¹) within the first 50–250 epochs, followed by stabilization.
2. **Accuracy Growth**: Test accuracy plateaus at ~0.8 for all tasks, indicating a performance ceiling.
3. **Task 3 Delay**: Task 3 begins training at epoch 400 but achieves similar performance to earlier tasks, suggesting efficient adaptation.
4. **Meta-Program Evolution**:
- Early epochs focus on `solve` operations.
- Later epochs introduce probabilistic reasoning (`probs`).
- Probability thresholds (e.g., `0.99`) increase over time.
---
### Interpretation
The chart demonstrates a meta-learning system that sequentially adapts to diverse reasoning tasks. The sharp initial drops in loss and rapid accuracy gains suggest effective parameter initialization or task-specific adaptation. The learned meta-programs evolve from deterministic logic (`solve`) to probabilistic reasoning (`probs`), reflecting a progression from basic to complex reasoning. Task 3’s delayed start but comparable performance highlights the system’s ability to generalize across tasks. The consistent accuracy plateau (~0.8) implies inherent task difficulty or data limitations. The meta-programs’ structure (e.g., nested `solve` calls) indicates hierarchical reasoning capabilities.