TECHNICAL ASSET FINGERPRINT
aabf04896daaecf0a2f4725b
Click to view fullscreen
Press ESC or click to close
FOUND IN PAPERS
EXPERT: healer-alpha-free VERSION 1
RUNTIME: free/openrouter/healer-alpha
INTEL_VERIFIED
## Bar Charts: Brain Alignment Comparison Across Models and Conditions
### Overview
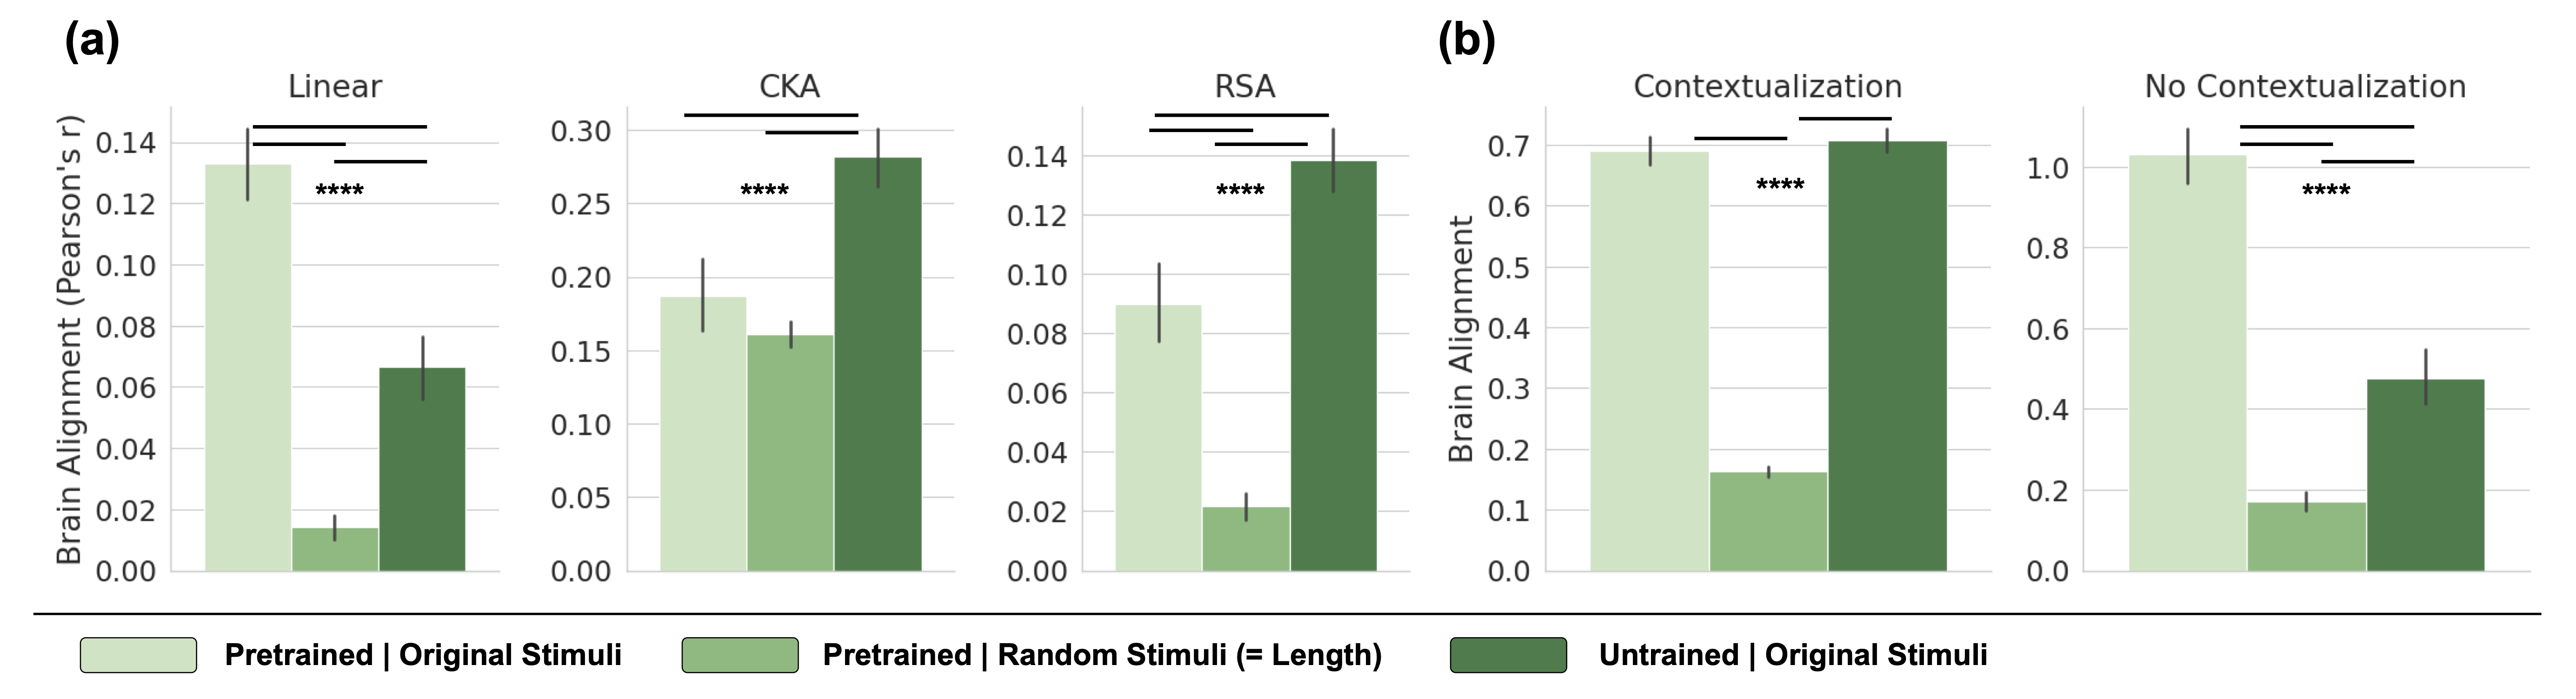
The image displays a composite figure containing five bar charts organized into two panels, labeled (a) and (b). The charts compare "Brain Alignment" (measured as Pearson's r) across three different experimental conditions for various model types or metrics. The overall purpose is to quantify and compare how well different computational models align with brain activity under different stimulus conditions.
### Components/Axes
* **Panel (a):** Contains three separate bar charts titled "Linear", "CKA", and "RSA".
* **Y-axis (for all three):** Labeled "Brain Alignment (Pearson's r)". The scale ranges from 0.00 to 0.14 for Linear and RSA, and from 0.00 to 0.30 for CKA.
* **X-axis:** Each chart has three bars corresponding to the conditions defined in the legend.
* **Panel (b):** Contains two separate bar charts titled "Contextualization" and "No Contextualization".
* **Y-axis (for both):** Labeled "Brain Alignment". The scale ranges from 0.0 to 0.7 for Contextualization and from 0.0 to 1.0 for No Contextualization.
* **X-axis:** Each chart has three bars corresponding to the conditions defined in the legend.
* **Legend:** Located at the bottom of the entire figure, spanning its width. It defines three color-coded conditions:
* **Light Green Bar:** "Pretrained | Original Stimuli"
* **Medium Green Bar:** "Pretrained | Random Stimuli (= Length)"
* **Dark Green Bar:** "Untrained | Original Stimuli"
* **Statistical Significance:** Horizontal brackets with four asterisks (****) are placed above pairs of bars in each chart, indicating a highly significant statistical difference between those conditions.
### Detailed Analysis
#### Panel (a) - Linear, CKA, RSA Metrics
**1. Linear Chart**
* **Trend:** The "Pretrained | Original Stimuli" condition shows the highest alignment, followed by "Untrained | Original Stimuli", with "Pretrained | Random Stimuli" showing very low alignment.
* **Approximate Values (Pearson's r):**
* Pretrained | Original Stimuli: ~0.133 (Error bar extends from ~0.12 to ~0.145)
* Pretrained | Random Stimuli: ~0.015 (Error bar extends from ~0.01 to ~0.02)
* Untrained | Original Stimuli: ~0.065 (Error bar extends from ~0.055 to ~0.075)
* **Significance:** The bracket with **** spans the "Pretrained | Original Stimuli" and "Pretrained | Random Stimuli" bars, indicating a significant difference.
**2. CKA Chart**
* **Trend:** The "Untrained | Original Stimuli" condition shows the highest alignment, followed by "Pretrained | Original Stimuli", with "Pretrained | Random Stimuli" slightly lower than the pretrained original.
* **Approximate Values (Pearson's r):**
* Pretrained | Original Stimuli: ~0.185 (Error bar extends from ~0.16 to ~0.21)
* Pretrained | Random Stimuli: ~0.16 (Error bar extends from ~0.15 to ~0.17)
* Untrained | Original Stimuli: ~0.28 (Error bar extends from ~0.26 to ~0.30)
* **Significance:** The bracket with **** spans the "Pretrained | Original Stimuli" and "Untrained | Original Stimuli" bars.
**3. RSA Chart**
* **Trend:** Similar to CKA, the "Untrained | Original Stimuli" condition shows the highest alignment, followed by "Pretrained | Original Stimuli", with "Pretrained | Random Stimuli" showing very low alignment.
* **Approximate Values (Pearson's r):**
* Pretrained | Original Stimuli: ~0.09 (Error bar extends from ~0.08 to ~0.105)
* Pretrained | Random Stimuli: ~0.02 (Error bar extends from ~0.015 to ~0.025)
* Untrained | Original Stimuli: ~0.138 (Error bar extends from ~0.125 to ~0.15)
* **Significance:** The bracket with **** spans the "Pretrained | Original Stimuli" and "Untrained | Original Stimuli" bars.
#### Panel (b) - Contextualization Conditions
**1. Contextualization Chart**
* **Trend:** The "Untrained | Original Stimuli" and "Pretrained | Original Stimuli" conditions show similarly high alignment, both far exceeding the "Pretrained | Random Stimuli" condition.
* **Approximate Values (Brain Alignment):**
* Pretrained | Original Stimuli: ~0.69 (Error bar extends from ~0.67 to ~0.71)
* Pretrained | Random Stimuli: ~0.16 (Error bar extends from ~0.15 to ~0.17)
* Untrained | Original Stimuli: ~0.71 (Error bar extends from ~0.69 to ~0.73)
* **Significance:** The bracket with **** spans the "Pretrained | Original Stimuli" and "Pretrained | Random Stimuli" bars.
**2. No Contextualization Chart**
* **Trend:** The "Pretrained | Original Stimuli" condition shows the highest alignment, followed by "Untrained | Original Stimuli", with "Pretrained | Random Stimuli" showing low alignment.
* **Approximate Values (Brain Alignment):**
* Pretrained | Original Stimuli: ~1.03 (Error bar extends from ~0.95 to ~1.1)
* Pretrained | Random Stimuli: ~0.17 (Error bar extends from ~0.15 to ~0.19)
* Untrained | Original Stimuli: ~0.48 (Error bar extends from ~0.42 to ~0.54)
* **Significance:** The bracket with **** spans the "Pretrained | Original Stimuli" and "Pretrained | Random Stimuli" bars.
### Key Observations
1. **Consistent Low Performance of Random Stimuli:** Across all five charts, the "Pretrained | Random Stimuli (= Length)" condition (medium green bar) consistently yields the lowest brain alignment scores. This serves as a critical control, showing that alignment is not driven by low-level stimulus properties like length.
2. **Divergent Effects of Training:** The effect of pretraining versus no training varies by metric and context.
* In **Linear** and **No Contextualization** settings, the *Pretrained* model with original stimuli outperforms the *Untrained* model.
* In **CKA** and **RSA** metrics, and in the **Contextualization** setting, the *Untrained* model with original stimuli shows equal or higher alignment than the *Pretrained* model.
3. **Impact of Contextualization:** Comparing the two charts in panel (b), the "Contextualization" condition appears to equalize the performance of pretrained and untrained models on original stimuli, whereas in the "No Contextualization" condition, the pretrained model has a clear advantage.
4. **Scale Differences:** The absolute values of "Brain Alignment" differ substantially between panels. Panel (a) values are in the range of 0.0-0.3 (Pearson's r), while panel (b) values are much higher, ranging up to ~1.0. This suggests the metrics or underlying data in (a) and (b) are fundamentally different.
### Interpretation
This figure investigates the factors that contribute to a computational model's representations aligning with brain activity. The data suggests several key insights:
1. **Content Over Randomness:** The consistently poor performance of models exposed to "Random Stimuli" demonstrates that meaningful brain alignment requires exposure to structured, naturalistic input (the "Original Stimuli"). The brain's response is tuned to real-world patterns, not random noise of the same length.
2. **The Role of Training is Context-Dependent:** Pretraining is not universally beneficial for brain alignment. Its advantage appears specific to certain readout methods (Linear) or processing stages (No Contextualization). In other contexts (CKA, RSA, with Contextualization), an untrained model's initial random weights can sometimes yield representations that align *better* with brain data. This challenges the assumption that training on language necessarily moves representations closer to brain-like representations for all comparison metrics.
3. **Contextualization as an Equalizer:** The process of "Contextualization" (likely involving integrating information across a sequence or context) seems to diminish the representational advantage conferred by pretraining. This could imply that the brain's processing of context is a fundamental operation that both trained and untrained systems can approximate, or that pretraining primarily improves non-contextual aspects of representation.
4. **Metric Sensitivity:** The starkly different results between Linear, CKA, and RSA metrics highlight that "brain alignment" is not a single, monolithic concept. Different mathematical comparisons (linear mapping, kernel similarity, representational similarity) capture different aspects of the relationship between model and brain representations, leading to different conclusions about the effects of training.
In summary, the figure provides evidence that brain-model alignment is a nuanced phenomenon heavily dependent on the nature of the input (structured vs. random), the model's training history, the specific computational process being measured (contextualization), and the mathematical tool used for comparison. It argues against a simple narrative that "more training equals better brain alignment."
DECODING INTELLIGENCE...