## Diagram: Network Flow Variations
### Overview
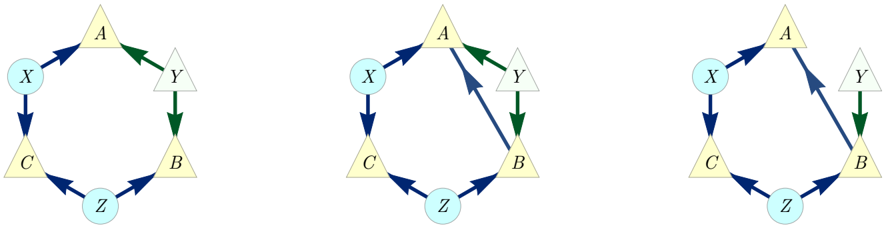
The image presents three variations of a network flow diagram. Each diagram consists of nodes labeled A, B, C, X, Y, and Z, connected by directed edges (arrows). The nodes A, B, and C are represented as triangles, while X, Y, and Z are represented as circles. The arrows indicate the direction of flow between the nodes. The diagrams differ in the specific connections and flow directions between the nodes.
### Components/Axes
* **Nodes:**
* A, B, C (represented as triangles)
* X, Y, Z (represented as circles)
* **Edges:** Directed arrows indicating flow direction.
* Blue arrows: Represent one type of flow.
* Green arrows: Represent another type of flow.
### Detailed Analysis
**Diagram 1 (Left)**
* **Nodes:** A, B, C, X, Y, Z
* **Flow:**
* A to X (blue arrow)
* X to C (blue arrow)
* C to Z (blue arrow)
* Z to B (blue arrow)
* B to Y (green arrow)
* A to Y (green arrow)
**Diagram 2 (Center)**
* **Nodes:** A, B, C, X, Y, Z
* **Flow:**
* A to X (blue arrow)
* X to C (blue arrow)
* C to Z (blue arrow)
* Z to B (blue arrow)
* B to A (blue arrow)
* B to Y (green arrow)
* Y to B (green arrow)
**Diagram 3 (Right)**
* **Nodes:** A, B, C, X, Y, Z
* **Flow:**
* A to X (blue arrow)
* X to C (blue arrow)
* C to Z (blue arrow)
* Z to B (blue arrow)
* A to B (blue arrow)
* B to Y (green arrow)
* Y to B (green arrow)
### Key Observations
* All three diagrams share the same set of nodes (A, B, C, X, Y, Z).
* The flow from X to C to Z to B is consistent across all three diagrams (blue arrows).
* The primary differences lie in the connections involving nodes A and Y.
* The green arrows always connect to node Y.
### Interpretation
The diagrams illustrate different possible network configurations or flow patterns between the nodes. The consistent flow from X to C to Z to B suggests a core pathway, while the variations in connections involving A and Y indicate alternative routes or dependencies. The green arrows highlight a specific type of flow or interaction associated with node Y. The diagrams could represent different states or scenarios within a system, highlighting the flexibility and adaptability of the network.