## Grid Matrix: Sparse Data Distribution
### Overview
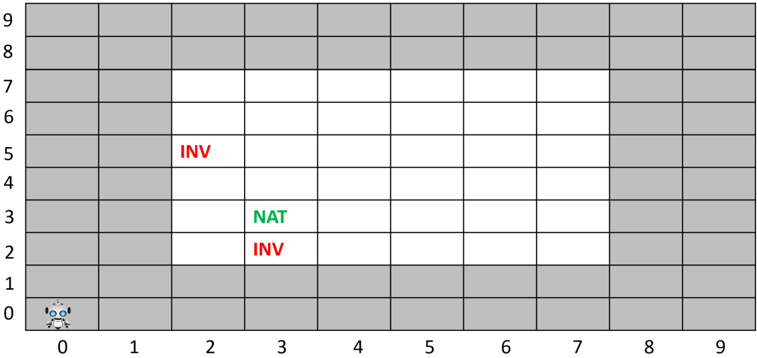
The image depicts a 10x10 grid (rows 0-9, columns 0-9) with sparse annotations. A robot icon is positioned at the origin (0,0). Three cells contain text labels: two marked "INV" (red) and one marked "NAT" (green). The grid lacks explicit axis titles, legends, or numerical values beyond positional coordinates.
### Components/Axes
- **Rows**: Labeled 0 (bottom) to 9 (top), left-aligned.
- **Columns**: Labeled 0 (left) to 9 (right), top-aligned.
- **Annotations**:
- Red text "INV" at (5,2) and (2,2).
- Green text "NAT" at (3,2).
- **Legend**: Implicit color coding (red = "INV", green = "NAT"). No explicit legend box present.
### Detailed Analysis
- **Robot Icon**: Positioned at (0,0), stylized with blue eyes and antennae.
- **Colored Cells**:
- (5,2): Red "INV" (row 5, column 2).
- (3,2): Green "NAT" (row 3, column 2).
- (2,2): Red "INV" (row 2, column 2).
- **Empty Cells**: 97/100 cells unmarked.
### Key Observations
1. **Sparse Data**: Only 3/100 cells contain annotations.
2. **Vertical Clustering**: Two "INV" labels occupy adjacent rows (2 and 5) in column 2.
3. **Color Coding**: Red dominates annotations (2 instances), green appears once.
4. **Robot Proximity**: All annotations are ≥2 columns away from the robot icon.
### Interpretation
The grid likely represents a spatial distribution system (e.g., inventory tracking, resource mapping). The robot’s position at (0,0) suggests a reference point or autonomous agent. The "INV" labels may indicate inventory locations, while "NAT" could denote natural resources or nodes. The lack of numerical values or explicit context limits quantitative analysis. The vertical proximity of "INV" labels in column 2 might imply a localized cluster, but this requires further data to confirm.
**Note**: No explicit trends or numerical relationships can be derived from the sparse annotations. Additional metadata (e.g., grid purpose, color legend definitions) is required for deeper analysis.