## Bar Chart: AUROC by Representation Type and Hallucination Association
### Overview
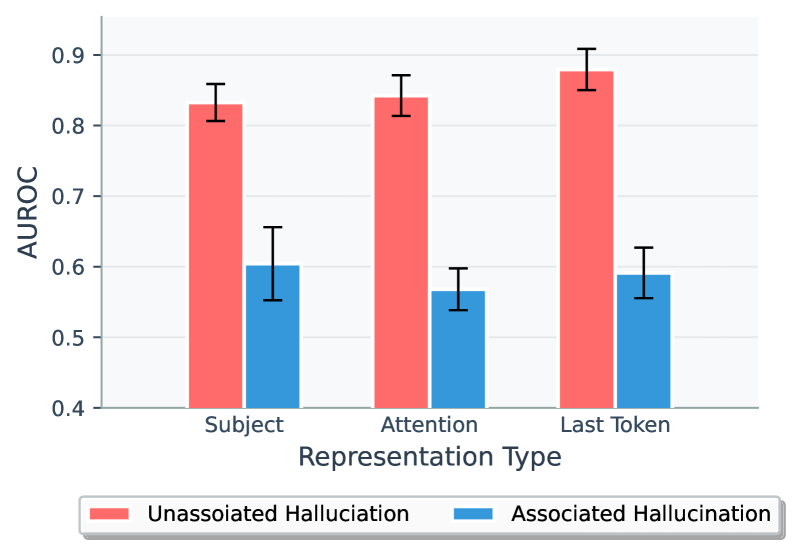
The image is a bar chart comparing the Area Under the Receiver Operating Characteristic curve (AUROC) for different representation types (Subject, Attention, Last Token) and their association with hallucinations (Unassociated, Associated). The chart displays the AUROC values on the y-axis, ranging from 0.4 to 0.9. The x-axis represents the representation type. Error bars are included on each bar, indicating the variability or uncertainty in the AUROC values.
### Components/Axes
* **Y-axis:** AUROC, ranging from 0.4 to 0.9 in increments of 0.1.
* **X-axis:** Representation Type, with three categories: Subject, Attention, and Last Token.
* **Legend:** Located at the bottom of the chart.
* Red: Unassociated Hallucination
* Blue: Associated Hallucination
### Detailed Analysis
The chart presents AUROC values for two categories of hallucinations (Unassociated and Associated) across three representation types.
* **Subject:**
* Unassociated Hallucination (Red): AUROC is approximately 0.83, with an error bar extending from approximately 0.80 to 0.86.
* Associated Hallucination (Blue): AUROC is approximately 0.60, with an error bar extending from approximately 0.55 to 0.65.
* **Attention:**
* Unassociated Hallucination (Red): AUROC is approximately 0.84, with an error bar extending from approximately 0.81 to 0.87.
* Associated Hallucination (Blue): AUROC is approximately 0.56, with an error bar extending from approximately 0.53 to 0.59.
* **Last Token:**
* Unassociated Hallucination (Red): AUROC is approximately 0.88, with an error bar extending from approximately 0.85 to 0.91.
* Associated Hallucination (Blue): AUROC is approximately 0.59, with an error bar extending from approximately 0.56 to 0.62.
### Key Observations
* For all representation types, the AUROC is higher for Unassociated Hallucinations (red bars) compared to Associated Hallucinations (blue bars).
* The "Last Token" representation type shows the highest AUROC for Unassociated Hallucinations, reaching approximately 0.88.
* The "Attention" representation type shows the lowest AUROC for Associated Hallucinations, at approximately 0.56.
* The error bars indicate some variability in the AUROC values, but the differences between Unassociated and Associated Hallucinations appear consistent across all representation types.
### Interpretation
The data suggests that the model is better at distinguishing Unassociated Hallucinations from non-hallucinations compared to distinguishing Associated Hallucinations from non-hallucinations, across all representation types tested. The "Last Token" representation appears to be the most effective for identifying Unassociated Hallucinations. The consistent difference in AUROC values between Unassociated and Associated Hallucinations across all representation types indicates a robust trend. The error bars provide a measure of the uncertainty in these estimates, but the overall pattern remains clear.