\n
## Chart: Verification Performance of SAT/UNSAT Property Checkers
### Overview
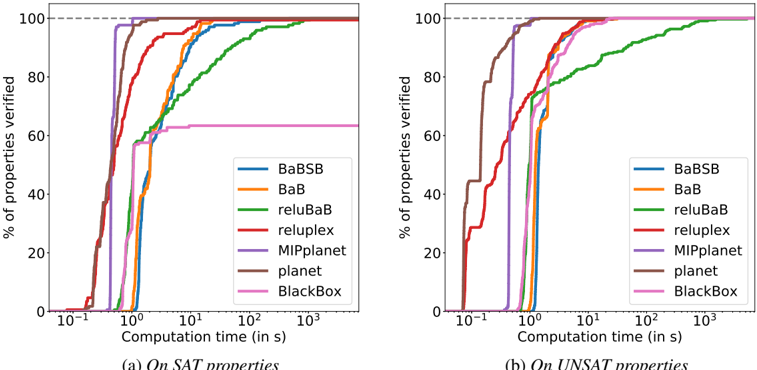
The image presents two line charts comparing the performance of six different property checkers (BaBSB, BaB, reluBaB, reluplex, MIPplanet, planet, and BlackBox) in verifying SAT and UNSAT properties. The x-axis represents computation time in seconds (logarithmic scale), and the y-axis represents the percentage of properties verified. The charts visually demonstrate how quickly each checker can verify a given percentage of properties.
### Components/Axes
* **X-axis:** Computation time (in s), logarithmic scale from approximately 10^-1 to 10^3.
* **Y-axis:** % of properties verified, scale from 0 to 100.
* **Left Chart Title:** (a) On SAT properties
* **Right Chart Title:** (b) On UNSAT properties
* **Legend (Both Charts):**
* BaBSB (Blue)
* BaB (Orange)
* reluBaB (Green)
* reluplex (Red)
* MIPplanet (Purple)
* planet (Brown)
* BlackBox (Pink)
### Detailed Analysis or Content Details
**Chart (a): On SAT properties**
* **BaBSB (Blue):** Starts at approximately 0% at 10^-1 s, rapidly increases to around 80% at 10^0 s, plateaus around 90% at 10^1 s, and reaches approximately 98% at 10^2 s.
* **BaB (Orange):** Starts at approximately 0% at 10^-1 s, increases to around 60% at 10^0 s, plateaus around 85% at 10^1 s, and reaches approximately 98% at 10^2 s.
* **reluBaB (Green):** Starts at approximately 0% at 10^-1 s, increases to around 50% at 10^0 s, plateaus around 75% at 10^1 s, and reaches approximately 95% at 10^2 s.
* **reluplex (Red):** Starts at approximately 0% at 10^-1 s, increases to around 30% at 10^0 s, plateaus around 60% at 10^1 s, and reaches approximately 85% at 10^2 s.
* **MIPplanet (Purple):** Starts at approximately 0% at 10^-1 s, increases to around 20% at 10^0 s, plateaus around 50% at 10^1 s, and reaches approximately 75% at 10^2 s.
* **planet (Brown):** Starts at approximately 0% at 10^-1 s, increases to around 10% at 10^0 s, plateaus around 30% at 10^1 s, and reaches approximately 50% at 10^2 s.
* **BlackBox (Pink):** Starts at approximately 0% at 10^-1 s, increases to around 5% at 10^0 s, plateaus around 15% at 10^1 s, and reaches approximately 30% at 10^2 s.
**Chart (b): On UNSAT properties**
* **BaBSB (Blue):** Starts at approximately 0% at 10^-1 s, rapidly increases to around 80% at 10^0 s, plateaus around 95% at 10^1 s, and reaches approximately 98% at 10^2 s.
* **BaB (Orange):** Starts at approximately 0% at 10^-1 s, increases to around 60% at 10^0 s, plateaus around 85% at 10^1 s, and reaches approximately 95% at 10^2 s.
* **reluBaB (Green):** Starts at approximately 0% at 10^-1 s, increases to around 40% at 10^0 s, plateaus around 70% at 10^1 s, and reaches approximately 90% at 10^2 s.
* **reluplex (Red):** Starts at approximately 0% at 10^-1 s, increases to around 20% at 10^0 s, plateaus around 50% at 10^1 s, and reaches approximately 75% at 10^2 s.
* **MIPplanet (Purple):** Starts at approximately 0% at 10^-1 s, increases to around 10% at 10^0 s, plateaus around 30% at 10^1 s, and reaches approximately 50% at 10^2 s.
* **planet (Brown):** Starts at approximately 0% at 10^-1 s, increases to around 5% at 10^0 s, plateaus around 15% at 10^1 s, and reaches approximately 30% at 10^2 s.
* **BlackBox (Pink):** Starts at approximately 0% at 10^-1 s, increases to around 2% at 10^0 s, plateaus around 10% at 10^1 s, and reaches approximately 20% at 10^2 s.
### Key Observations
* **BaBSB and BaB consistently outperform other checkers** in both SAT and UNSAT property verification, achieving higher verification percentages for a given computation time.
* **BlackBox consistently underperforms** compared to all other checkers.
* **The performance gap between checkers is more pronounced for UNSAT properties** than for SAT properties.
* **All checkers exhibit diminishing returns** as computation time increases, with the rate of verification slowing down at higher computation times.
### Interpretation
The charts demonstrate the effectiveness of different property checkers in verifying SAT and UNSAT properties. BaBSB and BaB appear to be the most efficient and scalable checkers, capable of verifying a large percentage of properties within a reasonable timeframe. The significant performance difference between the checkers suggests that the underlying algorithms and implementation details have a substantial impact on verification speed. The fact that the performance gap is wider for UNSAT properties could indicate that certain checkers are better suited for handling the specific challenges associated with proving unsatisfiability. The diminishing returns observed for all checkers suggest that there are inherent limitations to the verification process, and that further improvements in performance may require fundamentally new approaches. The poor performance of BlackBox suggests it may be unsuitable for practical property verification tasks. These results are valuable for researchers and practitioners seeking to select the most appropriate property checker for their specific needs.