TECHNICAL ASSET FINGERPRINT
ac1ec67abcb9b4f9d516cb72
Click to view fullscreen
Press ESC or click to close
FOUND IN PAPERS
EXPERT: gemini-2.0-flash VERSION 1
RUNTIME: nugit/gemini/gemini-2.0-flash
INTEL_VERIFIED
## Line Chart: I-Don't-Know Rate vs. Layer for Llama Models
### Overview
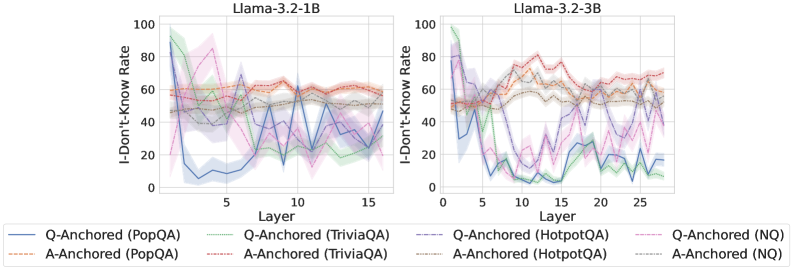
The image presents two line charts comparing the "I-Don't-Know Rate" across different layers of two Llama models (Llama-3.2-1B and Llama-3.2-3B) for various question-answering datasets. Each chart displays multiple data series, representing different anchoring methods (Q-Anchored and A-Anchored) on datasets like PopQA, TriviaQA, HotpotQA, and NQ. The charts aim to illustrate how the model's uncertainty varies across layers and datasets.
### Components/Axes
* **Titles:**
* Left Chart: "Llama-3.2-1B"
* Right Chart: "Llama-3.2-3B"
* **Y-Axis (Vertical):**
* Label: "I-Don't-Know Rate"
* Scale: 0 to 100, with tick marks at 0, 20, 40, 60, 80, and 100.
* **X-Axis (Horizontal):**
* Label: "Layer"
* Left Chart Scale: 0 to 15, with tick marks at 0, 5, 10, and 15.
* Right Chart Scale: 0 to 25, with tick marks at 0, 5, 10, 15, 20, and 25.
* **Legend:** Located at the bottom of the image, it identifies each data series by color and label:
* Blue: Q-Anchored (PopQA)
* Brown Dashed: A-Anchored (PopQA)
* Green: Q-Anchored (TriviaQA)
* Gray Dotted: A-Anchored (TriviaQA)
* Teal Dashed: Q-Anchored (HotpotQA)
* Orange: A-Anchored (HotpotQA)
* Pink Dashed: Q-Anchored (NQ)
* Gray Dotted: A-Anchored (NQ)
### Detailed Analysis
#### Llama-3.2-1B (Left Chart)
* **Q-Anchored (PopQA) - Blue:** Starts high (around 60-70) and drops sharply to around 10-20 by layer 5, then fluctuates between 10 and 40 for the remaining layers.
* Layer 0: ~65
* Layer 5: ~10
* Layer 10: ~30
* Layer 15: ~40
* **A-Anchored (PopQA) - Brown Dashed:** Relatively stable, fluctuating between 50 and 70 across all layers.
* Layer 0: ~55
* Layer 5: ~60
* Layer 10: ~60
* Layer 15: ~60
* **Q-Anchored (TriviaQA) - Green:** Starts high (near 100) and decreases to around 30-40 by layer 5, then fluctuates between 20 and 60.
* Layer 0: ~95
* Layer 5: ~40
* Layer 10: ~30
* Layer 15: ~20
* **A-Anchored (TriviaQA) - Gray Dotted:** Starts around 60, decreases to 40 by layer 5, and then fluctuates between 40 and 60.
* Layer 0: ~60
* Layer 5: ~40
* Layer 10: ~50
* Layer 15: ~50
* **Q-Anchored (HotpotQA) - Teal Dashed:** Starts around 50, decreases to 30 by layer 5, and then fluctuates between 20 and 50.
* Layer 0: ~50
* Layer 5: ~30
* Layer 10: ~40
* Layer 15: ~30
* **A-Anchored (HotpotQA) - Orange:** Relatively stable, fluctuating between 50 and 70 across all layers.
* Layer 0: ~55
* Layer 5: ~60
* Layer 10: ~60
* Layer 15: ~60
* **Q-Anchored (NQ) - Pink Dashed:** Starts high (around 80), decreases to around 40 by layer 5, and then fluctuates between 20 and 60.
* Layer 0: ~80
* Layer 5: ~40
* Layer 10: ~60
* Layer 15: ~30
* **A-Anchored (NQ) - Gray Dotted:** Starts around 50, decreases to 40 by layer 5, and then fluctuates between 40 and 60.
* Layer 0: ~50
* Layer 5: ~40
* Layer 10: ~50
* Layer 15: ~50
#### Llama-3.2-3B (Right Chart)
* **Q-Anchored (PopQA) - Blue:** Starts high (around 50-60) and drops sharply to around 5-10 by layer 5, then fluctuates between 5 and 30 for the remaining layers.
* Layer 0: ~55
* Layer 5: ~5
* Layer 15: ~20
* Layer 25: ~20
* **A-Anchored (PopQA) - Brown Dashed:** Relatively stable, fluctuating between 50 and 70 across all layers.
* Layer 0: ~50
* Layer 5: ~60
* Layer 15: ~65
* Layer 25: ~70
* **Q-Anchored (TriviaQA) - Green:** Starts high (near 100) and decreases to around 10-20 by layer 5, then fluctuates between 10 and 40.
* Layer 0: ~95
* Layer 5: ~10
* Layer 15: ~30
* Layer 25: ~20
* **A-Anchored (TriviaQA) - Gray Dotted:** Starts around 50, decreases to 40 by layer 5, and then fluctuates between 40 and 60.
* Layer 0: ~50
* Layer 5: ~40
* Layer 15: ~50
* Layer 25: ~50
* **Q-Anchored (HotpotQA) - Teal Dashed:** Starts around 50, decreases to 10 by layer 5, and then fluctuates between 5 and 30.
* Layer 0: ~50
* Layer 5: ~10
* Layer 15: ~20
* Layer 25: ~20
* **A-Anchored (HotpotQA) - Orange:** Relatively stable, fluctuating between 50 and 70 across all layers.
* Layer 0: ~50
* Layer 5: ~60
* Layer 15: ~65
* Layer 25: ~70
* **Q-Anchored (NQ) - Pink Dashed:** Starts high (around 80), decreases to around 20 by layer 5, and then fluctuates between 10 and 50.
* Layer 0: ~80
* Layer 5: ~20
* Layer 15: ~40
* Layer 25: ~30
* **A-Anchored (NQ) - Gray Dotted:** Starts around 50, decreases to 40 by layer 5, and then fluctuates between 40 and 60.
* Layer 0: ~50
* Layer 5: ~40
* Layer 15: ~50
* Layer 25: ~50
### Key Observations
* **Initial Drop:** For both models, the Q-Anchored series (PopQA, TriviaQA, HotpotQA, NQ) generally show a significant drop in the "I-Don't-Know Rate" within the first few layers (around layer 5).
* **A-Anchored Stability:** The A-Anchored series (PopQA, TriviaQA, HotpotQA, NQ) tend to be more stable, with less fluctuation across layers.
* **Model Comparison:** The Llama-3.2-3B model (right chart) has a longer x-axis (more layers) than the Llama-3.2-1B model (left chart).
* **Dataset Variation:** The "I-Don't-Know Rate" varies significantly depending on the dataset used.
### Interpretation
The charts suggest that the model's uncertainty (as measured by the "I-Don't-Know Rate") is highly dependent on the anchoring method (Q vs. A) and the specific question-answering dataset. The initial drop in the Q-Anchored series indicates that the model quickly gains confidence in its answers as it processes the initial layers. The relative stability of the A-Anchored series might indicate a more consistent level of uncertainty throughout the layers.
The difference in the number of layers between the two models (Llama-3.2-1B vs. Llama-3.2-3B) could be a factor in their performance and uncertainty characteristics. The longer model (3B) might have more capacity to learn and refine its answers, potentially leading to different patterns in the "I-Don't-Know Rate" across layers.
The variation across datasets highlights the importance of dataset-specific training and evaluation. The model's uncertainty is likely influenced by the complexity, ambiguity, and domain knowledge required for each dataset.
DECODING INTELLIGENCE...