\n
## Diagram: Neural Network with Prediction Outputs
### Overview
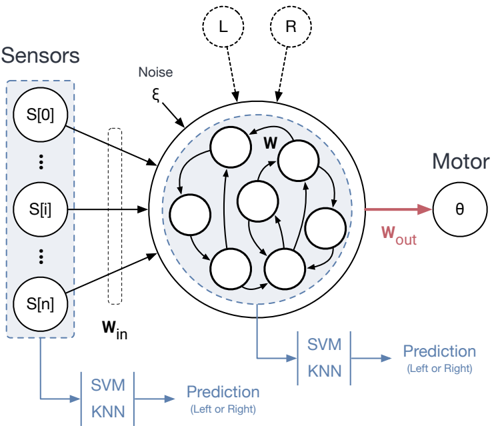
The image depicts a diagram of a neural network processing sensor input to produce a motor output and a prediction. The network is shown as a circular arrangement of interconnected nodes, with inputs from sensors, noise, and direct left/right signals. Outputs are directed towards a motor control signal and a prediction module utilizing SVM and KNN algorithms.
### Components/Axes
The diagram consists of the following components:
* **Sensors:** Represented by a blue rectangular box labeled "Sensors" containing a series of nodes labeled "S[0]", "S[i]", and "S[n]". The "i" and "n" suggest a sequence or index.
* **Neural Network:** A circular arrangement of interconnected nodes enclosed within a light blue shaded circle. The nodes are labeled "W".
* **Inputs:** Three input sources: "Noise" (labeled ξ), "L" (Left), and "R" (Right).
* **Weights:** Input weights are labeled "w<sub>in</sub>" and output weights are labeled "w<sub>out</sub>".
* **Motor:** Represented by a circle labeled "θ".
* **Prediction Module:** A block labeled "SVM KNN" with outputs labeled "Prediction (Left or Right)".
* **Arrows:** Indicate the flow of information between components.
### Detailed Analysis / Content Details
The diagram illustrates the following flow:
1. **Sensor Input:** Sensor data S[0] through S[n] is fed into the neural network.
2. **Noise Input:** Noise (ξ) is also fed into the neural network.
3. **Direct Inputs:** Direct signals for "Left" (L) and "Right" (R) are also fed into the neural network.
4. **Neural Network Processing:** The inputs are processed within the network (W), utilizing input weights (w<sub>in</sub>).
5. **Motor Output:** The processed signal is outputted as a motor control signal (θ) using output weights (w<sub>out</sub>).
6. **Prediction Output:** The output of the neural network is also fed into a prediction module utilizing Support Vector Machines (SVM) and K-Nearest Neighbors (KNN) algorithms. This module generates a prediction of "Left or Right".
The neural network itself appears to have a complex, fully connected structure within the circular arrangement. The arrows indicate bidirectional connections between nodes.
### Key Observations
* The diagram emphasizes the integration of sensor data, noise, and direct signals for decision-making.
* The use of both a motor output and a prediction output suggests a system that not only acts but also anticipates or classifies.
* The inclusion of SVM and KNN indicates a hybrid approach to prediction, potentially combining the strengths of both algorithms.
* The notation S[i] and S[n] suggests a time series or sequential data input from the sensors.
### Interpretation
This diagram represents a computational model for decision-making, likely in a robotic or control system. The neural network acts as a central processing unit, integrating various sources of information to generate both a motor command and a prediction. The inclusion of noise as an input suggests the system is designed to be robust to uncertainty. The use of SVM and KNN for prediction indicates a desire for accurate classification, potentially for error checking or adaptive control. The system appears to be designed to respond to external stimuli (Left/Right) while also learning from sensor data. The diagram is a high-level conceptual representation and does not provide specific details about the network architecture, learning algorithms, or performance metrics. It is a schematic illustration of a system's functional components and their interconnections.