## Diagram: Clusters - opposite - large - brackets - say small
### Overview
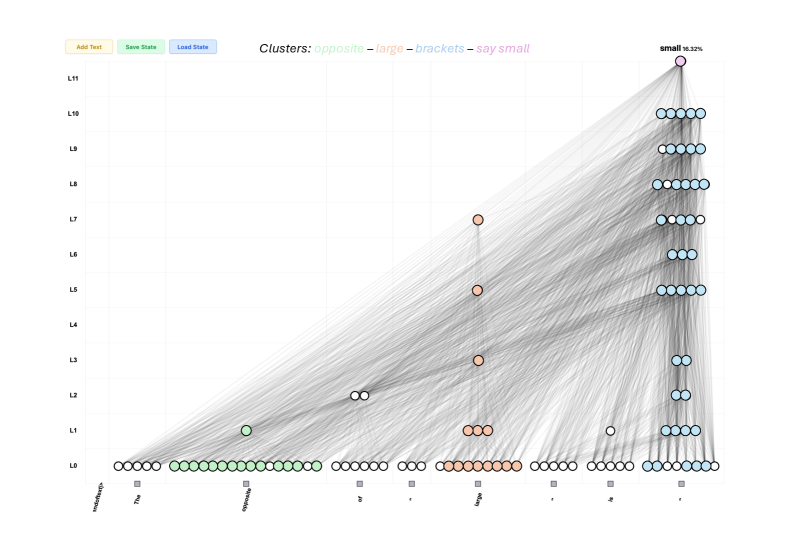
The image presents a diagram visualizing clusters of relationships between words, represented as lines connecting points on a two-dimensional plane. The diagram appears to be a type of alluvial diagram or parallel coordinates plot, showing how words transition between different categories or "layers" (L0 to L11). The title indicates the clusters being visualized are related to "opposite", "large", "brackets", and "say small".
### Components/Axes
* **Horizontal Axis (X-axis):** Represents word categories. The categories are: "the", "opposite", "is", "-", "large", "-", "-", "-", "-", "-", "-". The categories are not evenly spaced.
* **Vertical Axis (Y-axis):** Represents layers, labeled L0 to L11. These layers likely represent stages or transformations in the relationships between words.
* **Lines:** Gray lines connect points across layers, indicating relationships between words as they move through the layers. The density of lines indicates the strength or frequency of the relationship.
* **Circles:** Colored circles represent clusters of words at different layers. The size of the circle appears to correlate with the number of words in that cluster.
* **Legend:** Located in the top-right corner, the legend indicates the color coding for the clusters: "small 16.32%".
* **Controls:** Located in the top-left corner, there are buttons labeled "Add Text", "Save State", and "Load State".
* **Title:** "Clusters: opposite - large - brackets - say small" is positioned at the top-center of the diagram.
### Detailed Analysis
The diagram shows a complex network of relationships between words. The lines originate from the left side (L0) and converge towards the right side (L11).
* **L0:** A large number of lines originate from the "the" and "opposite" categories.
* **L1:** The lines begin to diverge, with some moving towards "is" and others towards the "-" categories.
* **L2-L5:** The lines continue to spread out, with a noticeable concentration of lines moving towards the "-" categories.
* **L6-L9:** The lines begin to converge again, with a significant number of lines moving towards the "-" categories.
* **L10-L11:** The lines converge towards the rightmost categories, with a cluster of blue circles appearing.
**Cluster Analysis:**
* **Small (16.32%):** The cluster represented by the blue circles is most prominent in layers L8 through L11. The size of the circles increases as the layers increase, indicating a growing concentration of words in this cluster.
* **Green Circle:** A single green circle is present at L1.
* **Orange Circles:** Several orange circles are present at L2, L3, and L4.
* **Yellow Circles:** Several yellow circles are present at L3, L4, and L5.
The number of lines originating from "the" and "opposite" in L0 is significantly higher than from other categories, suggesting these words are central to the relationships being visualized. The convergence of lines towards the rightmost categories in L11 indicates a final grouping or categorization of words.
### Key Observations
* The diagram shows a clear flow of relationships from left to right.
* The "the" and "opposite" categories appear to be the starting points for many relationships.
* The "-" categories act as intermediate points in the flow.
* The blue cluster ("small") becomes increasingly prominent in the later layers.
* The diagram is dense with lines, indicating a complex network of relationships.
### Interpretation
This diagram likely represents a visualization of semantic relationships between words, potentially derived from a large corpus of text. The layers could represent stages of linguistic analysis, such as part-of-speech tagging, dependency parsing, or semantic role labeling. The lines represent associations between words as they move through these stages.
The prominence of "the" and "opposite" suggests these words are frequently used in the context of the analyzed text. The convergence towards the "small" cluster in the later layers indicates that the relationships between words ultimately lead to the concept of "smallness". The diagram could be used to understand how words are related to each other in a specific domain or corpus, and to identify key concepts and relationships.
The presence of the "Add Text", "Save State", and "Load State" buttons suggests this is an interactive visualization tool, allowing users to explore the relationships between words and save their findings. The diagram is a powerful tool for visualizing complex linguistic data and gaining insights into the semantic relationships between words.