\n
## Diagram: Block Diagram of a Signal Processing System
### Overview
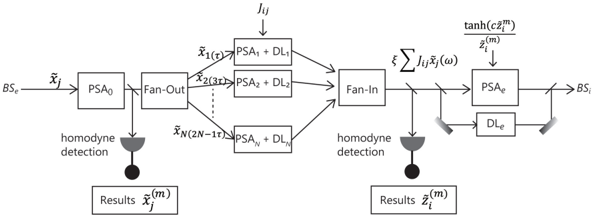
The image presents a block diagram illustrating a signal processing system. The diagram depicts a series of processing blocks connected by arrows indicating signal flow. The system appears to involve multiple stages of processing, including power spectral analysis (PSA), delay lines (DL), fan-out and fan-in operations, and a non-linear transformation (tanh). The diagram also includes homodyne detection and result outputs.
### Components/Axes
The diagram consists of the following components:
* **BS<sub>i</sub>**: Input signal.
* **PSA<sub>0</sub>**: Power Spectral Analysis block.
* **Fan-Out**: Splits the signal into multiple paths.
* **PSA<sub>A</sub> + DL<sub>i</sub>**: Power Spectral Analysis and Delay Line blocks (indexed by 'i').
* **x<sub>1</sub>(τ)**, **x<sub>2</sub>(3τ)**, **x<sub>N</sub>(2N-1τ)**: Intermediate signals.
* **J<sub>f</sub>**: Input signal to the first PSA/DL block.
* **Fan-In**: Combines multiple signals into a single path.
* **∑ J<sub>f</sub>x<sub>j</sub>(ω)**: Summation block.
* **PSA<sub>e</sub>**: Power Spectral Analysis block.
* **DL<sub>e</sub>**: Delay Line block.
* **tanh(cz<sup>m</sup>)**: Non-linear transformation.
* **z<sup>(m)</sup>**: Intermediate signal.
* **homodyne detection**: Detection block.
* **Results x<sub>j</sub><sup>(m)</sup>**: Output results.
* **Results z<sub>j</sub><sup>(m)</sup>**: Output results.
* **BS<sub>e</sub>**: Output signal.
### Detailed Analysis or Content Details
The signal flow can be described as follows:
1. An input signal **BS<sub>i</sub>** enters the system and is processed by **PSA<sub>0</sub>**.
2. The output of **PSA<sub>0</sub>** is split into multiple parallel paths via a **Fan-Out** block.
3. Each path consists of a **PSA<sub>A</sub>** block followed by a **DL<sub>i</sub>** block. The input **J<sub>f</sub>** is also fed into the first **PSA<sub>A</sub> + DL<sub>i</sub>** block.
4. The outputs of the parallel paths are combined using a **Fan-In** block.
5. The combined signal is then processed by **PSA<sub>e</sub>** and **DL<sub>e</sub>**.
6. The output of **DL<sub>e</sub>** is passed through a non-linear transformation **tanh(cz<sup>m</sup>)**.
7. The final output signal **BS<sub>e</sub>** is generated.
8. Homodyne detection is performed on the outputs of the **Fan-Out** and **Fan-In** blocks, resulting in **Results x<sub>j</sub><sup>(m)</sup>** and **Results z<sub>j</sub><sup>(m)</sup>**, respectively.
The diagram does not provide specific numerical values or quantitative data. It is a schematic representation of a signal processing architecture.
### Key Observations
The system utilizes parallel processing with multiple PSA and DL blocks. The fan-out and fan-in operations suggest a form of signal averaging or combining. The non-linear transformation introduces a degree of complexity and potentially allows for signal shaping or feature extraction. The homodyne detection indicates that the system is sensitive to the phase of the input signal.
### Interpretation
This diagram likely represents a system for signal detection or estimation. The parallel processing and averaging operations could be used to improve signal-to-noise ratio. The non-linear transformation may be used to enhance specific signal features or to implement a decision rule. The homodyne detection suggests that the system is designed to operate with coherent signals. The overall architecture suggests a sophisticated signal processing system capable of extracting information from noisy or complex signals. The diagram is a high-level representation and does not provide details about the specific algorithms or parameters used in each block. The use of 'τ' and 'ω' suggests time and frequency domain processing, respectively. The indices 'i', 'j', 'f', 'e', and 'm' likely represent different channels, frequencies, or iterations within the system.