## Line Chart: Complexity and Surplus over Time
### Overview
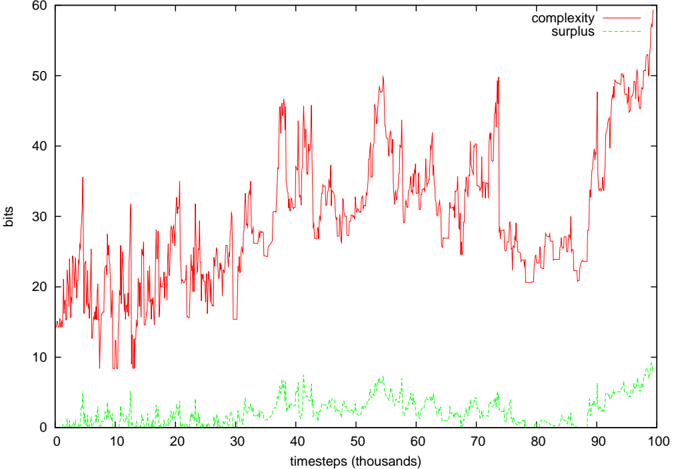
The image is a line chart that plots "complexity" and "surplus" over time. The x-axis represents time in thousands of steps, ranging from 0 to 100. The y-axis represents the value in "bits", ranging from 0 to 60. The "complexity" is represented by a solid red line, and the "surplus" is represented by a dashed green line.
### Components/Axes
* **X-axis:**
* Label: "timesteps (thousands)"
* Scale: 0 to 100, with tick marks at intervals of 10.
* **Y-axis:**
* Label: "bits"
* Scale: 0 to 60, with tick marks at intervals of 10.
* **Legend (top-right):**
* "complexity" - solid red line
* "surplus" - dashed green line
### Detailed Analysis
* **Complexity (Red Line):**
* Trend: Initially fluctuates between approximately 15 and 25 bits for the first 30,000 timesteps. Between 30,000 and 80,000 timesteps, the complexity fluctuates between approximately 25 and 45 bits. After 80,000 timesteps, the complexity increases sharply, reaching approximately 55 bits at 100,000 timesteps.
* Approximate Values:
* At timestep 0: ~15 bits
* At timestep 30,000: ~30 bits
* At timestep 50,000: ~35 bits
* At timestep 80,000: ~30 bits
* At timestep 100,000: ~55 bits
* **Surplus (Green Dashed Line):**
* Trend: Remains relatively low and stable between 0 and 5 bits for the first 80,000 timesteps. After 80,000 timesteps, the surplus begins to increase, reaching approximately 10 bits at 100,000 timesteps.
* Approximate Values:
* At timestep 0: ~2 bits
* At timestep 80,000: ~2 bits
* At timestep 100,000: ~10 bits
### Key Observations
* The complexity exhibits significant fluctuations throughout the entire period.
* The surplus remains low for a long period before increasing towards the end.
* Both complexity and surplus increase significantly after 80,000 timesteps.
### Interpretation
The chart suggests that the system's complexity and surplus are initially relatively stable. However, after a certain point (around 80,000 timesteps), both measures experience a notable increase. This could indicate a phase transition or a significant change in the system's dynamics. The initial stability in surplus, followed by a later increase, might suggest a build-up of resources or potential before a period of growth or change. The fluctuations in complexity could represent ongoing adaptation or exploration within the system. The correlation between the increase in complexity and surplus after 80,000 timesteps suggests that they are related, possibly with increased complexity leading to a higher surplus.