TECHNICAL ASSET FINGERPRINT
ac6be221fa9cc68137eab699
Click to view fullscreen
Press ESC or click to close
FOUND IN PAPERS
EXPERT: gemini-3.1-pro-preview VERSION 1
RUNTIME: gemini/gemini-3.1-pro-preview
INTEL_VERIFIED
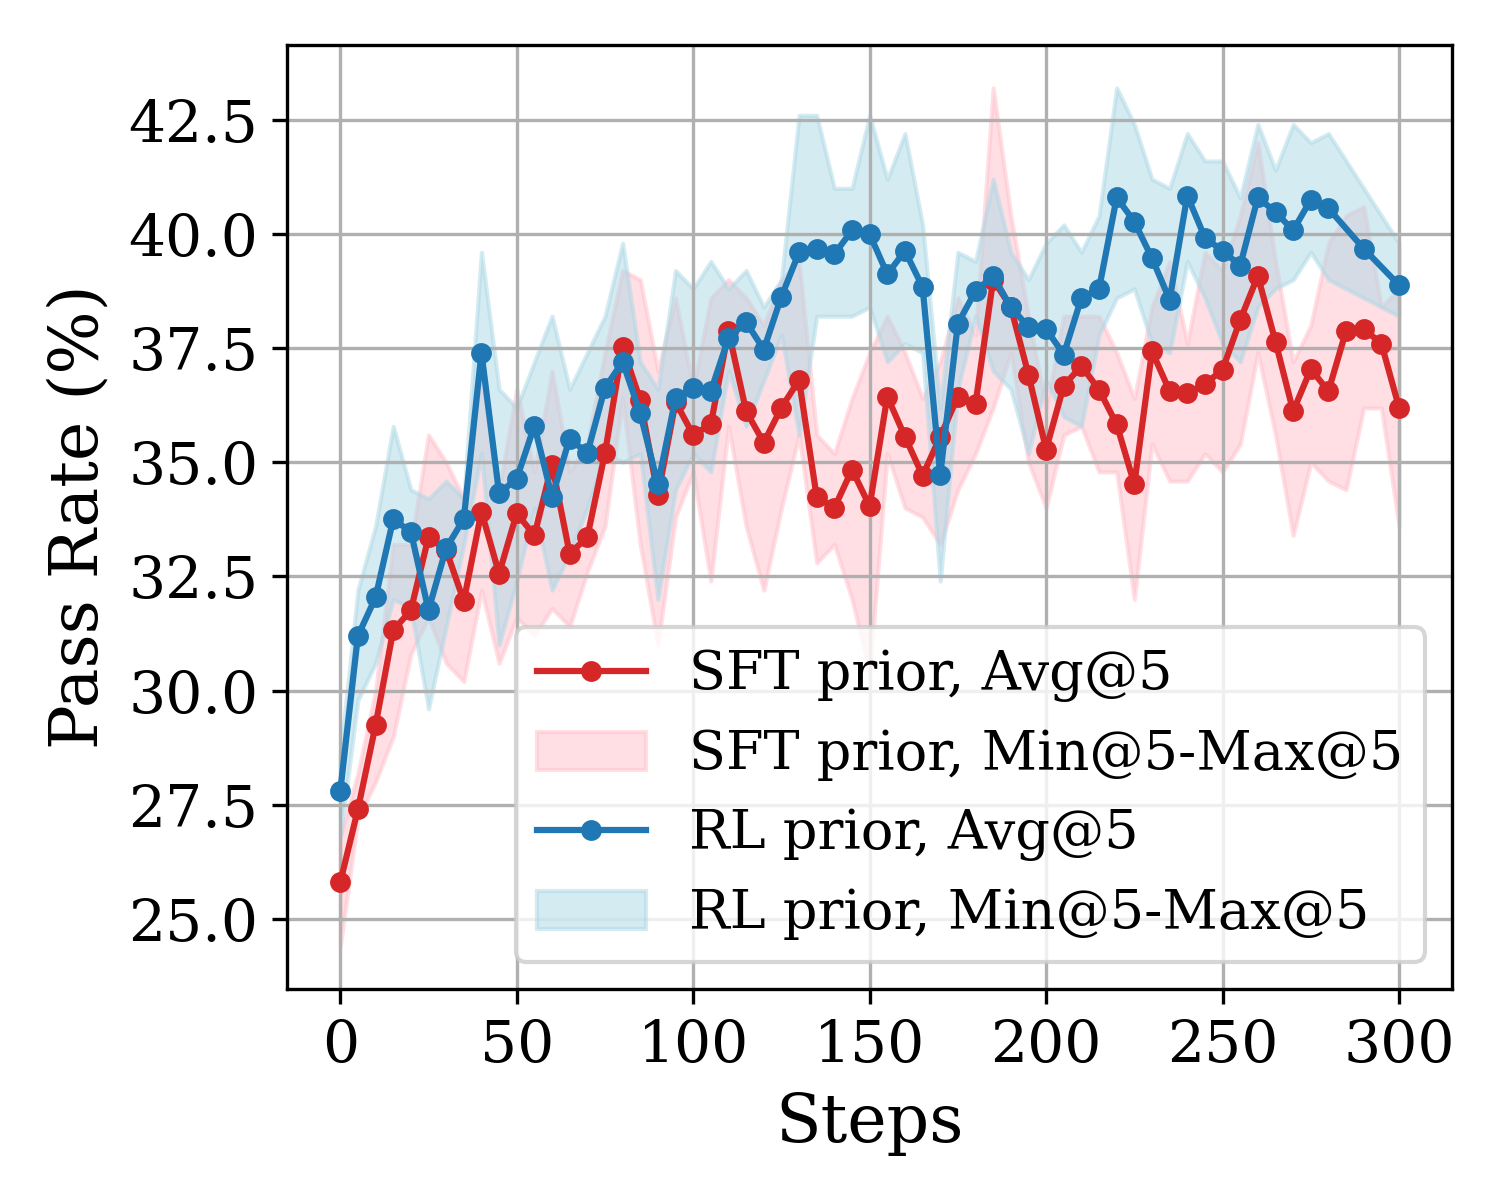
## Line Chart: Pass Rate vs. Steps for SFT and RL Priors
### Overview
This image is a technical line chart displaying the performance metric "Pass Rate (%)" over a series of training or evaluation "Steps". It compares two different methodologies or initializations: "SFT prior" and "RL prior". The chart includes average performance lines alongside shaded regions representing the variance (minimum to maximum range) across multiple runs (specifically, 5 runs, as indicated by "@5"). The sole language present in the image is English.
### Components/Axes
**1. Spatial Grounding & Layout:**
* **Main Chart:** Occupies the central area, overlaid on a gray grid with major gridlines corresponding to the axis ticks.
* **Y-Axis (Left):** Vertical axis representing the performance metric.
* **X-Axis (Bottom):** Horizontal axis representing time or progression.
* **Legend (Bottom Right):** Positioned inside the main chart area, in the lower right quadrant, bounded by a thin light-gray border.
**2. Axis Details:**
* **Y-Axis Label:** "Pass Rate (%)" (Rotated 90 degrees counter-clockwise, centered vertically).
* **Y-Axis Scale/Markers:** Linear scale. Ticks are marked at intervals of 2.5. Visible markers: 25.0, 27.5, 30.0, 32.5, 35.0, 37.5, 40.0, 42.5.
* **X-Axis Label:** "Steps" (Centered horizontally below the axis).
* **X-Axis Scale/Markers:** Linear scale. Ticks are marked at intervals of 50. Visible markers: 0, 50, 100, 150, 200, 250, 300.
**3. Legend Details (Cross-referenced with chart elements):**
* **Red line with circular marker:** Labeled `SFT prior, Avg@5`. Corresponds to the solid red line with dot markers tracking the average pass rate.
* **Light pink shaded rectangle:** Labeled `SFT prior, Min@5-Max@5`. Corresponds to the light red/pink shaded band behind the red line, representing the variance.
* **Blue line with circular marker:** Labeled `RL prior, Avg@5`. Corresponds to the solid blue line with dot markers tracking the average pass rate.
* **Light blue shaded rectangle:** Labeled `RL prior, Min@5-Max@5`. Corresponds to the light blue shaded band behind the blue line, representing the variance.
### Detailed Analysis
**Trend Verification & Data Extraction:**
* **Series 1: RL prior, Avg@5 (Blue Line)**
* *Visual Trend:* The blue line starts slightly higher than the red line. It exhibits a steep initial climb during the first 50 steps. From step 50 to 300, it continues a gradual upward trend but with significant step-to-step volatility (zigzagging). It consistently remains above the red line for the vast majority of the chart.
* *Key Approximate Data Points (±0.5% uncertainty):*
* Step 0: ~27.8%
* Step 25: ~33.5%
* Step 50: ~34.5%
* Step 100: ~36.5%
* Step 150: ~40.0%
* Step 200: ~38.0%
* Step 220 (Peak): ~41.0%
* Step 250: ~39.5%
* Step 300: ~39.0%
* **Series 2: SFT prior, Avg@5 (Red Line)**
* *Visual Trend:* The red line starts at the lowest point on the graph. It also climbs sharply in the first 50 steps. After step 50, it plateaus and oscillates heavily. It experiences a notable dip between steps 125 and 175 before recovering. It generally tracks below the blue line.
* *Key Approximate Data Points (±0.5% uncertainty):*
* Step 0: ~25.8%
* Step 25: ~33.5% (Briefly intersects/matches the blue line)
* Step 50: ~33.5%
* Step 100: ~35.5%
* Step 150: ~34.0% (Notable dip)
* Step 200: ~35.5%
* Step 260 (Peak): ~39.0%
* Step 300: ~36.2%
* **Variance Bands (Min@5-Max@5):**
* *RL prior (Light Blue):* The variance is relatively tight at the beginning but expands significantly as training progresses. Around Step 130-150, the band spans from roughly 38% to 43%. At Step 220, it spans from roughly 38% to 43.5%.
* *SFT prior (Light Pink):* This band also expands over time. It shows extreme variance spikes, particularly around Step 180 where the minimum drops to ~34% and the maximum spikes to ~43.5%.
### Key Observations
1. **Superiority of RL Prior:** The "RL prior" consistently outperforms the "SFT prior" in terms of the average Pass Rate across almost the entire 300-step duration.
2. **High Volatility:** Both methods exhibit high step-to-step volatility in their average scores, indicated by the jagged nature of both lines.
3. **Increasing Variance:** The shaded regions for both methods grow wider as the steps increase, indicating that the outcomes of individual runs (the 5 runs making up the min/max) diverge more from one another later in the process compared to the beginning.
4. **Overlapping Ranges:** Despite the blue average line being consistently higher, the light blue and light pink shaded areas overlap significantly. This means that a "best-case" SFT run could occasionally outperform a "worst-case" RL run at specific steps.
### Interpretation
In the context of machine learning (specifically Large Language Models or similar AI training paradigms), this chart likely compares two different starting points or foundational models before applying a subsequent training phase (the "Steps" on the X-axis).
* **SFT prior:** Supervised Fine-Tuning prior.
* **RL prior:** Reinforcement Learning prior (likely RLHF - Reinforcement Learning from Human Feedback).
**What the data suggests:**
Starting a new training phase with a model that has already undergone Reinforcement Learning (RL prior) yields a higher and faster-converging "Pass Rate" (likely on a coding, reasoning, or specific benchmark task) compared to starting with a model that has only undergone Supervised Fine-Tuning (SFT prior).
**Reading between the lines (Peircean investigative):**
The notation "@5" strongly implies that the researchers ran this experiment 5 separate times with different random seeds to ensure statistical reliability. The fact that they included the Min-Max bands rather than just standard deviation shows they want to highlight the absolute best and worst-case scenarios.
The high volatility (zigzagging) of the average lines, combined with the widening variance bands, suggests that the training process occurring over these 300 steps is somewhat unstable. The model is learning (the overall trend is up), but it is "forgetting" or fluctuating wildly between evaluation steps. The RL prior not only achieves a higher ceiling but appears slightly more robust against the severe dips seen in the SFT prior (e.g., the SFT dip at step 150). Ultimately, the data advocates for using the RL-tuned model as the base for whatever subsequent training is being measured here.
DECODING INTELLIGENCE...