## Line Graph: Validation Loss vs. Tokens Seen (Image-Caption and Interleaved)
### Overview
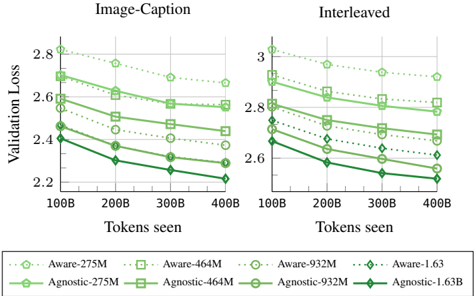
The image is a line graph comparing validation loss across different model sizes and architectures (Aware and Agnostic) as a function of tokens seen. Two x-axis categories are labeled "Image-Caption" and "Interleaved," with the y-axis representing "Validation Loss" (ranging from 2.2 to 3.0). Multiple data series are plotted, each corresponding to a model variant (e.g., Aware-275M, Agnostic-275M) with distinct colors and markers.
### Components/Axes
- **X-Axis (Horizontal)**:
- Label: "Tokens seen"
- Categories: 100B, 200B, 300B, 400B (increasing left to right)
- Subcategories: "Image-Caption" (left) and "Interleaved" (right)
- **Y-Axis (Vertical)**:
- Label: "Validation Loss"
- Scale: 2.2 to 3.0 (increasing downward)
- **Legend (Bottom)**:
- **Aware Models**:
- Aware-275M: Dotted line with circle markers (light green)
- Aware-464M: Dotted line with square markers (light green)
- Aware-932M: Dotted line with circle markers (light green)
- Aware-1.63B: Dotted line with diamond markers (light green)
- **Agnostic Models**:
- Agnostic-275M: Solid line with square markers (dark green)
- Agnostic-464M: Solid line with square markers (dark green)
- Agnostic-932M: Solid line with circle markers (dark green)
- Agnostic-1.63B: Solid line with diamond markers (dark green)
### Detailed Analysis
#### Image-Caption Section
- **Aware-275M**: Starts at ~2.8 (100B tokens) and decreases to ~2.6 (400B tokens).
- **Aware-464M**: Starts at ~2.7 and decreases to ~2.5.
- **Aware-932M**: Starts at ~2.6 and decreases to ~2.4.
- **Aware-1.63B**: Starts at ~2.5 and decreases to ~2.3.
- **Agnostic-275M**: Starts at ~2.6 and decreases to ~2.4.
- **Agnostic-464M**: Starts at ~2.5 and decreases to ~2.3.
- **Agnostic-932M**: Starts at ~2.4 and decreases to ~2.2.
- **Agnostic-1.63B**: Starts at ~2.3 and decreases to ~2.1.
#### Interleaved Section
- **Aware-275M**: Starts at ~3.0 and decreases to ~2.8.
- **Aware-464M**: Starts at ~2.9 and decreases to ~2.7.
- **Aware-932M**: Starts at ~2.8 and decreases to ~2.6.
- **Aware-1.63B**: Starts at ~2.7 and decreases to ~2.5.
- **Agnostic-275M**: Starts at ~2.8 and decreases to ~2.6.
- **Agnostic-464M**: Starts at ~2.7 and decreases to ~2.5.
- **Agnostic-932M**: Starts at ~2.6 and decreases to ~2.4.
- **Agnostic-1.63B**: Starts at ~2.5 and decreases to ~2.3.
### Key Observations
1. **Downward Trend**: All models show a consistent decrease in validation loss as tokens seen increase, indicating improved performance with more data.
2. **Model Efficiency**:
- Aware models consistently outperform Agnostic models (lower validation loss) across all token ranges.
- Larger models (e.g., 1.63B) achieve lower loss than smaller models (e.g., 275M) in both sections.
3. **Interleaved vs. Image-Caption**:
- Interleaved section starts with higher validation loss than Image-Caption but follows a similar downward trend.
- The gap between Aware and Agnostic models is narrower in the Interleaved section.
### Interpretation
The data suggests that:
- **Increased Token Exposure** improves model performance (lower validation loss) for all architectures.
- **Aware Models** are more efficient, likely due to better alignment with task-specific data (e.g., image-caption pairs).
- **Interleaved Training** (mixing tasks) introduces higher initial loss but converges similarly to Image-Caption training, though with slightly less efficiency.
- **Model Size** directly impacts performance: larger models (1.63B) achieve lower loss than smaller ones, highlighting the trade-off between computational cost and accuracy.
### Spatial Grounding and Trend Verification
- **Legend Placement**: Bottom of the graph, clearly mapping colors/markers to model names.
- **Line Trends**:
- Aware-275M (dotted circle) slopes downward in both sections.
- Agnostic-1.63B (solid diamond) shows the steepest decline in the Interleaved section.
- **Color Consistency**: All Aware models use light green shades, while Agnostic models use dark green, ensuring visual distinction.
### Content Details
- **Data Points**:
- For example, Aware-932M in Image-Caption starts at ~2.6 (100B tokens) and ends at ~2.4 (400B tokens).
- Agnostic-464M in Interleaved starts at ~2.7 (100B tokens) and ends at ~2.5 (400B tokens).
- **Markers**: Circles, squares, and diamonds differentiate model sizes within each category (Aware/Agnostic).
### Notable Patterns
- **Convergence**: All models approach similar loss values at 400B tokens, suggesting diminishing returns beyond a certain token threshold.
- **Interleaved Complexity**: Higher initial loss in Interleaved may reflect the challenge of balancing multiple tasks during training.
This analysis confirms that Aware models with larger capacities (e.g., 1.63B) are optimal for tasks requiring high validation accuracy, while smaller models may suffice for resource-constrained scenarios.