\n
## Bar Charts: SHD Test Accuracy vs. Total Recurrent Neurons
### Overview
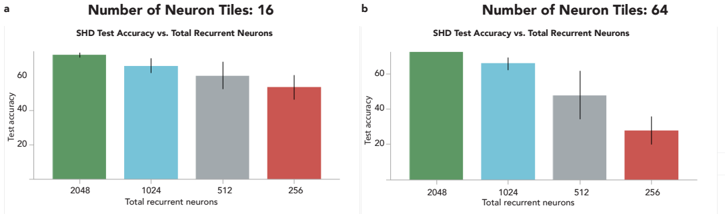
The image presents two bar charts (labeled 'a' and 'b') comparing SHD (Symmetric Hausdorff Distance) test accuracy against the total number of recurrent neurons. Each chart represents a different number of neuron tiles: 16 in chart 'a' and 64 in chart 'b'. The x-axis represents the total number of recurrent neurons, and the y-axis represents the test accuracy. Error bars are included on each bar.
### Components/Axes
* **Chart a:**
* Title: "Number of Neuron Tiles: 16"
* Subtitle: "SHD Test Accuracy vs. Total Recurrent Neurons"
* X-axis Label: "Total recurrent neurons"
* X-axis Markers: 2048, 1024, 512, 256
* Y-axis Label: "Test accuracy"
* **Chart b:**
* Title: "Number of Neuron Tiles: 64"
* Subtitle: "SHD Test Accuracy vs. Total Recurrent Neurons"
* X-axis Label: "Total recurrent neurons"
* X-axis Markers: 2048, 1024, 512, 256
* Y-axis Label: "Test accuracy"
* **Color Scheme:**
* 2048 neurons: Green
* 1024 neurons: Light Blue
* 512 neurons: Gray
* 256 neurons: Red
### Detailed Analysis or Content Details
**Chart a (16 Neuron Tiles):**
* **2048 Neurons:** The green bar indicates a test accuracy of approximately 68. The error bar extends from roughly 65 to 71.
* **1024 Neurons:** The light blue bar shows a test accuracy of approximately 64. The error bar extends from roughly 61 to 67.
* **512 Neurons:** The gray bar indicates a test accuracy of approximately 59. The error bar extends from roughly 56 to 62.
* **256 Neurons:** The red bar shows a test accuracy of approximately 52. The error bar extends from roughly 49 to 55.
**Chart b (64 Neuron Tiles):**
* **2048 Neurons:** The green bar indicates a test accuracy of approximately 68. The error bar extends from roughly 65 to 71.
* **1024 Neurons:** The light blue bar shows a test accuracy of approximately 64. The error bar extends from roughly 61 to 67.
* **512 Neurons:** The gray bar indicates a test accuracy of approximately 46. The error bar extends from roughly 43 to 49.
* **256 Neurons:** The red bar shows a test accuracy of approximately 30. The error bar extends from roughly 27 to 33.
### Key Observations
* In both charts, the test accuracy generally decreases as the number of recurrent neurons decreases.
* The highest accuracy is achieved with 2048 neurons in both scenarios.
* The difference in accuracy between 2048 and 1024 neurons is relatively small.
* The accuracy drop from 512 to 256 neurons is more substantial.
* Chart 'b' (64 neuron tiles) shows a more pronounced decrease in accuracy with fewer neurons compared to chart 'a' (16 neuron tiles).
### Interpretation
The data suggests that increasing the number of recurrent neurons generally improves SHD test accuracy, up to a point. However, the benefit of adding more neurons diminishes as the number increases. The difference in performance between 16 and 64 neuron tiles indicates that the configuration of neuron tiles impacts the effectiveness of increasing the number of recurrent neurons. With 64 tiles, the accuracy drops more significantly when reducing the number of neurons. This could indicate that a certain level of granularity (provided by the 16 tiles) is necessary to fully utilize a larger number of recurrent neurons. The error bars suggest that the observed differences in accuracy are statistically significant, but there is still some variability in the results. The charts demonstrate a trade-off between model complexity (number of neurons) and performance (test accuracy).