## Diagram: Astrocyte Structure and Signaling Dynamics
### Overview
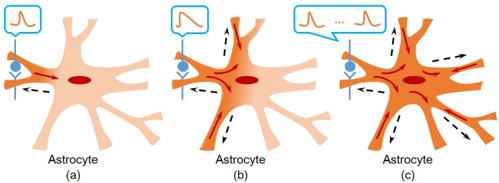
The image is a three-panel diagram illustrating astrocytes (a type of glial cell) with varying structural and functional characteristics. Each panel highlights differences in dendritic processes, signaling activity, and interaction with neurons. The diagram uses color-coded elements to distinguish components and directional arrows to indicate flow or interaction.
---
### Components/Axes
1. **Panels**:
- **(a)**: Basic astrocyte structure with minimal dendritic branching.
- **(b)**: Intermediate astrocyte with increased dendritic complexity.
- **(c)**: Advanced astrocyte with extensive dendritic branching and multiple signaling nodes.
2. **Key Elements**:
- **Astrocyte Cell Body**: Red oval (central structure).
- **Dendritic Processes**: Orange branches extending from the cell body.
- **Neuron**: Blue circle (connected to astrocytes via dashed arrows).
- **Speech Bubbles**: Represent signaling activity (peaks labeled "Signal 1," "Signal 2," etc.).
- **Arrows**: Dashed black arrows indicate directional flow (e.g., neurotransmitter release, ion flux).
3. **Legend**:
- **Blue**: Neuron.
- **Red**: Astrocyte cell body.
- **Orange**: Dendritic processes.
---
### Detailed Analysis
- **Panel (a)**:
- Single dendritic branch with no labeled signaling activity.
- One dashed arrow connects the neuron to the astrocyte.
- Speech bubble shows a single peak ("Signal 1"), suggesting minimal or baseline signaling.
- **Panel (b)**:
- Two dendritic branches with moderate branching.
- Two dashed arrows connect the neuron to the astrocyte.
- Speech bubble shows two peaks ("Signal 1" and "Signal 2"), indicating increased signaling activity.
- **Panel (c)**:
- Five dendritic branches with extensive branching.
- Three dashed arrows connect the neuron to the astrocyte.
- Speech bubble shows three peaks ("Signal 1," "Signal 2," "Signal 3"), representing heightened or multiplexed signaling.
- **Color Consistency**:
- All panels use the same color coding (blue neuron, red cell body, orange processes), ensuring clarity in component identification.
---
### Key Observations
1. **Progressive Complexity**: Astrocytes in panels (a) to (c) show increasing dendritic complexity, correlating with higher signaling activity.
2. **Signal Correlation**: The number of peaks in speech bubbles matches the number of dashed arrows, suggesting a direct relationship between neuronal input and astrocyte signaling.
3. **Directionality**: Arrows consistently point from the neuron to the astrocyte, implying unidirectional signaling (e.g., neurotransmitter release from the neuron to the astrocyte).
---
### Interpretation
The diagram illustrates how astrocytes modulate neuronal signaling through dendritic complexity. The progression from (a) to (c) suggests that:
- **Dendritic Branching**: Enhances the astrocyte's capacity to receive and process signals from neurons.
- **Signaling Peaks**: Represent distinct functional states (e.g., resting, activated, or modulated states) influenced by neuronal input.
- **Biological Relevance**: Astrocytes may act as integrators of synaptic activity, with dendritic architecture determining their responsiveness to neuronal signals. The dashed arrows could symbolize calcium waves, neurotransmitter uptake, or ion channel activity.
This model aligns with known astrocyte functions in synaptic pruning, neurotransmitter regulation, and network homeostasis. The increasing complexity in panel (c) might reflect pathological states (e.g., neurodegeneration) or adaptive responses to environmental stimuli.