\n
## Scatter Plots: Correlation of Method Score vs. Human Score
### Overview
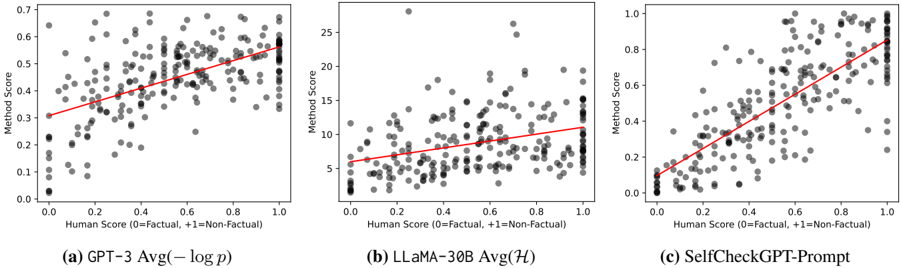
The image presents three scatter plots, each comparing "Method Score" against "Human Score". Each plot represents a different model: (a) GPT-3 Avg(-log p), (b) LLaMA-30B Avg(H), and (c) SelfCheckGPT-Prompt. A red line of best fit is overlaid on each scatter plot. The x-axis represents the Human Score, and the y-axis represents the Method Score.
### Components/Axes
* **X-axis Label (all plots):** "Human Score (0=Factual, +1=Non-Factual)" - Scale ranges from approximately 0.0 to 1.0.
* **Y-axis Label (all plots):** "Method Score" - Scale varies between plots.
* Plot (a): Scale ranges from approximately 0.0 to 0.7.
* Plot (b): Scale ranges from approximately 2.5 to 26.
* Plot (c): Scale ranges from approximately 0.0 to 1.0.
* **Data Points (all plots):** Grey dots representing individual data points.
* **Regression Line (all plots):** Red line representing the linear regression fit to the data.
* **Plot Titles:**
* (a) "GPT-3 Avg(-log p)"
* (b) "LLaMA-30B Avg(H)"
* (c) "SelfCheckGPT-Prompt"
### Detailed Analysis or Content Details
**Plot (a): GPT-3 Avg(-log p)**
* **Trend:** The data points generally show a positive correlation, with the regression line sloping upwards from the bottom-left to the top-right. The spread of data points is relatively tight.
* **Data Points:**
* At Human Score ≈ 0.2, Method Score ≈ 0.25.
* At Human Score ≈ 0.4, Method Score ≈ 0.35.
* At Human Score ≈ 0.6, Method Score ≈ 0.45.
* At Human Score ≈ 0.8, Method Score ≈ 0.55.
* At Human Score ≈ 1.0, Method Score ≈ 0.6.
**Plot (b): LLaMA-30B Avg(H)**
* **Trend:** The data points show a positive correlation, but the spread is much wider than in Plot (a). The regression line is flatter.
* **Data Points:**
* At Human Score ≈ 0.2, Method Score ≈ 6.
* At Human Score ≈ 0.4, Method Score ≈ 8.
* At Human Score ≈ 0.6, Method Score ≈ 12.
* At Human Score ≈ 0.8, Method Score ≈ 18.
* At Human Score ≈ 1.0, Method Score ≈ 22.
**Plot (c): SelfCheckGPT-Prompt**
* **Trend:** The data points show a strong positive correlation, with the regression line sloping upwards. The spread is moderate.
* **Data Points:**
* At Human Score ≈ 0.2, Method Score ≈ 0.2.
* At Human Score ≈ 0.4, Method Score ≈ 0.35.
* At Human Score ≈ 0.6, Method Score ≈ 0.55.
* At Human Score ≈ 0.8, Method Score ≈ 0.7.
* At Human Score ≈ 1.0, Method Score ≈ 0.85.
### Key Observations
* All three models demonstrate a positive correlation between Human Score and Method Score, suggesting that the models generally agree with human assessments.
* LLaMA-30B (Plot b) exhibits the largest spread in Method Scores for a given Human Score, indicating greater variability in its performance.
* GPT-3 (Plot a) and SelfCheckGPT-Prompt (Plot c) have tighter distributions, suggesting more consistent performance.
* The scale of the Y-axis (Method Score) differs significantly between the models, making direct comparison of absolute Method Score values difficult.
### Interpretation
The plots illustrate the alignment between the scoring of different language models and human evaluation of factual correctness. The positive correlation in each plot suggests that the models are, to some extent, capable of identifying factual statements. However, the varying degrees of spread indicate differences in the reliability and consistency of these models.
LLaMA-30B's wider spread suggests it may be more sensitive to subtle variations in input or more prone to generating outputs with varying degrees of factual accuracy. GPT-3 and SelfCheckGPT-Prompt appear more stable in their assessments.
The different scales on the Y-axis imply that the "Method Score" is calculated differently for each model, or that the models operate on different scales of confidence or probability. Without knowing the specifics of how each "Method Score" is derived, it's difficult to make definitive comparisons.
The fact that all models show a positive correlation, even with different scales, suggests that the concept of "factual correctness" is being captured, albeit in different ways, by each model. The regression lines provide a visual representation of how well each model's score aligns with human judgment.