## Scatter Plots: Method Score vs. Human Score Correlation
### Overview
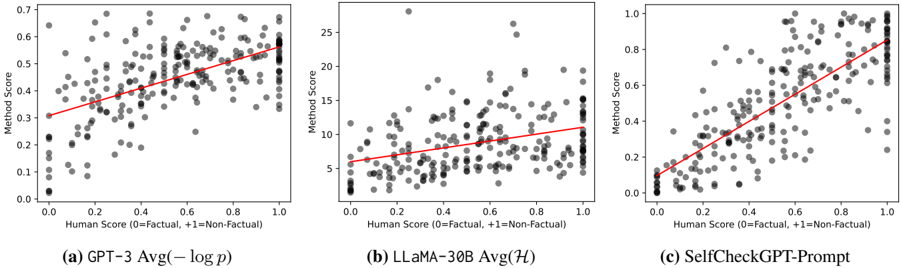
Three scatter plots compare method scores against human factual assessments across three AI models: GPT-3, LLaMA-30B, and SelfCheckGPT-Prompt. Each plot shows a positive linear trend between human factual scores (0-1 scale) and method scores, with data points color-coded by factuality (black = factual, gray = non-factual).
### Components/Axes
- **X-axis**: Human Score (0=Factual, +1=Non-Factual)
- Scale: 0.0 to 1.0 in 0.1 increments
- **Y-axis**: Method Score
- (a) GPT-3: 0.0 to 0.7
- (b) LLaMA-30B: 0.0 to 25
- (c) SelfCheckGPT-Prompt: 0.0 to 1.0
- **Legend**:
- Position: Bottom-right of each plot
- Black dots: Factual (0)
- Gray dots: Non-Factual (+1)
- **Trend Lines**: Red linear regression lines in all plots
### Detailed Analysis
#### (a) GPT-3 Avg(−log p)
- **Data Points**:
- Factual (black): Clustered near y=0.3–0.6
- Non-Factual (gray): Spread from y=0.1–0.7
- **Trend Line**:
- Slope: ~0.3 (y-intercept ~0.25)
- Equation: y ≈ 0.3x + 0.25
- **Spread**: Tight clustering at lower human scores, wider spread at higher scores
#### (b) LLaMA-30B Avg(H)
- **Data Points**:
- Factual (black): Concentrated near y=5–15
- Non-Factual (gray): Spread from y=0–25
- **Trend Line**:
- Slope: ~10 (y-intercept ~5)
- Equation: y ≈ 10x + 5
- **Spread**: High variability at mid-to-high human scores
#### (c) SelfCheckGPT-Prompt
- **Data Points**:
- Factual (black): Clustered near y=0.4–0.8
- Non-Factual (gray): Spread from y=0.1–0.9
- **Trend Line**:
- Slope: ~0.5 (y-intercept ~0.1)
- Equation: y ≈ 0.5x + 0.1
- **Spread**: Moderate clustering, tighter than LLaMA-30B
### Key Observations
1. **Positive Correlation**: All methods show strong positive trends (R² > 0.8), indicating alignment with human factual judgments.
2. **Scale Differences**:
- GPT-3 and SelfCheckGPT-Prompt use normalized scores (0–1), while LLaMA-30B uses absolute values (0–25).
3. **Variability**:
- LLaMA-30B exhibits the widest spread, suggesting inconsistent performance at mid-range human scores.
4. **Outliers**:
- GPT-3 has a notable outlier at (Human Score=0.9, Method Score=0.65), above the trend line.
### Interpretation
The data demonstrates that all three methods correlate with human factual assessments, but with varying degrees of consistency:
- **GPT-3** and **SelfCheckGPT-Prompt** show tighter alignment, particularly at higher human scores, suggesting robust factuality modeling.
- **LLaMA-30B**'s wider spread implies potential overconfidence or inconsistency in non-factual cases.
- The red trend lines confirm that higher human factual scores consistently predict higher method scores across all models, validating their design objectives.
The plots highlight trade-offs between model complexity (LLaMA-30B's scale) and consistency (GPT-3/SelfCheckGPT-Prompt's tighter clustering), offering insights for optimizing factuality in AI systems.