## Line Chart: Success Rate vs. Problem Size by Difficulty
### Overview
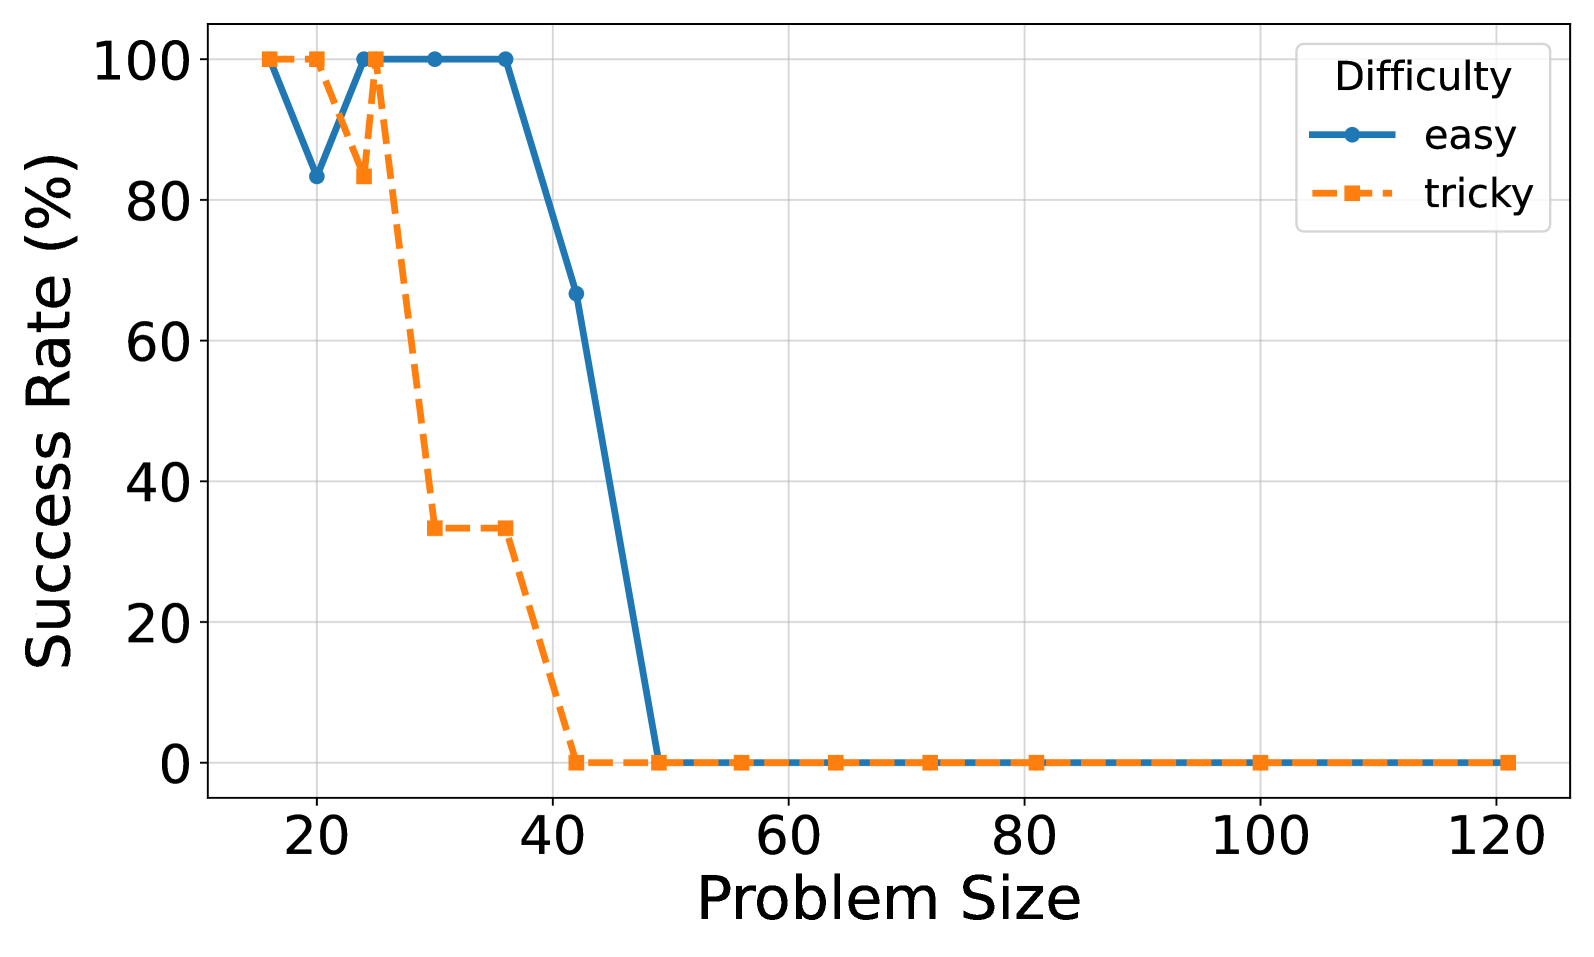
The image is a line chart comparing the success rate (%) against problem size for two difficulty levels: "easy" and "tricky". The x-axis represents the problem size, ranging from 0 to 120. The y-axis represents the success rate, ranging from 0% to 100%. The chart displays how the success rate changes with increasing problem size for each difficulty level.
### Components/Axes
* **Title:** There is no explicit title on the chart.
* **X-axis:**
* Label: "Problem Size"
* Scale: 0 to 120, with tick marks at intervals of 20 (20, 40, 60, 80, 100, 120).
* **Y-axis:**
* Label: "Success Rate (%)"
* Scale: 0 to 100, with tick marks at intervals of 20 (20, 40, 60, 80, 100).
* **Legend:** Located in the top-right corner.
* Title: "Difficulty"
* Entries:
* "easy": Represented by a solid blue line with circular markers.
* "tricky": Represented by a dashed orange line with square markers.
### Detailed Analysis
* **"easy" (Blue Line):**
* Trend: The success rate starts at 100% for smaller problem sizes, remains high until a problem size of approximately 40, and then decreases to near 0% as the problem size increases further.
* Data Points:
* Problem Size 20: Success Rate 100%
* Problem Size 30: Success Rate approximately 100%
* Problem Size 40: Success Rate approximately 100%
* Problem Size 50: Success Rate approximately 67%
* Problem Size 60 and beyond: Success Rate approximately 0%
* **"tricky" (Orange Line):**
* Trend: The success rate starts high, drops significantly around a problem size of 30, and then reaches near 0% after a problem size of 40.
* Data Points:
* Problem Size 20: Success Rate 100%
* Problem Size 30: Success Rate approximately 83%
* Problem Size 40: Success Rate approximately 33%
* Problem Size 50 and beyond: Success Rate approximately 0%
### Key Observations
* For smaller problem sizes (around 20), both "easy" and "tricky" problems have a 100% success rate.
* The success rate for "tricky" problems drops off more sharply than for "easy" problems as the problem size increases.
* Beyond a problem size of 60, the success rate for both difficulty levels is approximately 0%.
### Interpretation
The chart illustrates that as the problem size increases, the success rate decreases for both "easy" and "tricky" problems. However, "tricky" problems are more sensitive to problem size, experiencing a steeper decline in success rate compared to "easy" problems. This suggests that the "tricky" problems become significantly more difficult to solve as the problem size grows, while "easy" problems maintain a higher success rate for a slightly larger range of problem sizes before also dropping to near zero. The data implies that problem size is a critical factor affecting the success rate, and the difficulty level amplifies this effect.