\n
## Line Chart: Per-Period Regret vs. Time Period for Different Agents
### Overview
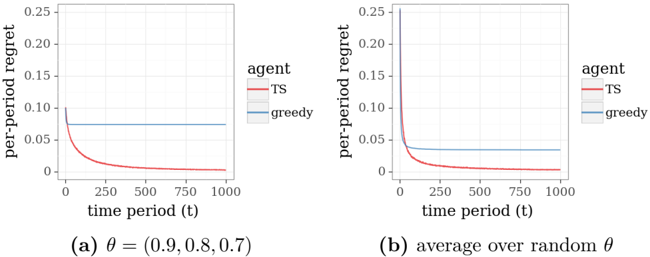
The image presents two line charts comparing the per-period regret of two agents, "TS" (Thompson Sampling) and "greedy", over time. The charts differ in the parameter setting used for the agents. The x-axis represents the time period (t), ranging from 0 to 1000. The y-axis represents the per-period regret, ranging from 0 to 0.25.
### Components/Axes
* **X-axis:** "time period (t)" - Scale from 0 to 1000, with markers at 0, 250, 500, 750, and 1000.
* **Y-axis:** "per-period regret" - Scale from 0 to 0.25, with markers at 0, 0.05, 0.10, 0.15, 0.20, and 0.25.
* **Legend:** Located in the top-right corner of each chart.
* "TS" - Represented by a red line.
* "greedy" - Represented by a blue line.
* **Chart (a):** Subtitle "(a) θ = (0.9, 0.8, 0.7)"
* **Chart (b):** Subtitle "(b) average over random θ"
### Detailed Analysis or Content Details
**Chart (a): θ = (0.9, 0.8, 0.7)**
* **TS (Red Line):** The line starts at approximately 0.08 and rapidly decreases to approximately 0.01 by time period 250. It continues to decrease slowly, reaching approximately 0.002 by time period 1000. The trend is strongly downward, indicating a rapid reduction in regret.
* **greedy (Blue Line):** The line starts at approximately 0.09 and remains relatively constant at around 0.08-0.09 throughout the entire time period (1000). The trend is flat, indicating consistent regret.
**Chart (b): average over random θ**
* **TS (Red Line):** The line starts at approximately 0.08 and rapidly decreases to approximately 0.01 by time period 250. It continues to decrease slowly, reaching approximately 0.003 by time period 1000. The trend is strongly downward, indicating a rapid reduction in regret.
* **greedy (Blue Line):** The line starts at approximately 0.09 and remains relatively constant at around 0.08-0.09 throughout the entire time period (1000). The trend is flat, indicating consistent regret.
### Key Observations
* In both charts, the "TS" agent consistently outperforms the "greedy" agent, exhibiting significantly lower per-period regret over time.
* The "greedy" agent's regret remains relatively constant, suggesting it does not adapt or learn from its actions.
* The initial regret for both agents is similar, but the "TS" agent quickly reduces its regret, while the "greedy" agent does not.
* The parameter setting (θ) does not appear to significantly impact the relative performance of the two agents, as the trends are similar in both charts.
### Interpretation
The data demonstrates the effectiveness of the Thompson Sampling (TS) agent in minimizing per-period regret compared to a greedy agent. The TS agent's ability to explore and learn from its actions allows it to adapt and improve its performance over time, leading to a substantial reduction in regret. The greedy agent, lacking this adaptive capability, maintains a consistently high level of regret.
The fact that the trends are similar in both charts (with specific θ values and averaged over random θ values) suggests that the superiority of TS over greedy is robust and not dependent on the specific parameter settings. This indicates that Thompson Sampling is a generally effective strategy for minimizing regret in this type of environment. The flat line for the greedy agent suggests it is stuck in a suboptimal strategy and unable to improve its performance. The rapid initial drop in regret for the TS agent indicates a quick learning phase, where it efficiently identifies better actions.