## Neural Turing Machine Visualization: Inputs, Outputs, Adds, Reads, Write Weightings, Read Weightings
### Overview
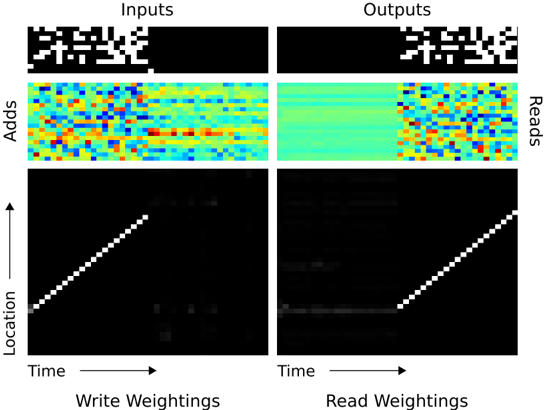
The image presents a visualization of the internal operations of a Neural Turing Machine (NTM). It shows the inputs and outputs, the memory additions and reads, and the write and read weightings over time and memory location. The visualization is split into two columns, representing the write and read operations respectively.
### Components/Axes
* **Top Row:**
* Left: "Inputs" - A binary matrix representing the input data.
* Right: "Outputs" - A binary matrix representing the output data.
* **Middle Row:**
* Left: "Adds" - A heatmap showing the values added to memory over time. The color scale ranges from blue (low values) to red (high values).
* Right: "Reads" - A heatmap showing the values read from memory over time. The color scale ranges from blue (low values) to red (high values).
* **Bottom Row:**
* Left: "Write Weightings" - A grayscale image representing the weights assigned to each memory location during the write operation over time.
* X-axis: "Time" (arrow pointing right)
* Y-axis: "Location" (arrow pointing up)
* Right: "Read Weightings" - A grayscale image representing the weights assigned to each memory location during the read operation over time.
* X-axis: "Time" (arrow pointing right)
* Y-axis: "Location" (arrow pointing up)
### Detailed Analysis
**1. Inputs and Outputs:**
* **Inputs (Top-Left):** The input data is represented as a sparse binary matrix. The left portion of the matrix contains a pattern of white and black squares, while the right portion is entirely black.
* **Outputs (Top-Right):** The output data is also represented as a sparse binary matrix. The left portion is entirely black, while the right portion contains a pattern of white and black squares.
**2. Adds and Reads:**
* **Adds (Middle-Left):** The "Adds" heatmap shows significant activity in the memory. There are fluctuations across the memory locations over time. The heatmap shows a range of values, with blue indicating lower values and red indicating higher values.
* **Reads (Middle-Right):** The "Reads" heatmap shows relatively low activity in the memory initially, followed by increased activity in the later time steps. The color intensity increases from left to right, indicating more significant read operations towards the end.
**3. Write and Read Weightings:**
* **Write Weightings (Bottom-Left):** The "Write Weightings" plot shows a diagonal line of high weights (white) moving from the bottom-left to the top-right. This indicates that the write operation is sequentially addressing memory locations. There are also some scattered, lower-intensity weights outside the main diagonal.
* **Read Weightings (Bottom-Right):** The "Read Weightings" plot also shows a diagonal line of high weights (white) moving from the bottom-left to the top-right. This indicates that the read operation is sequentially addressing memory locations. There are also some horizontal lines of lower intensity, suggesting that certain memory locations are being read repeatedly over time.
### Key Observations
* The input pattern appears to be "copied" to the output, but shifted in time.
* The "Adds" heatmap shows more initial activity compared to the "Reads" heatmap.
* Both "Write Weightings" and "Read Weightings" show a diagonal pattern, indicating sequential memory access.
### Interpretation
The visualization provides insights into how the NTM processes information. The sequential access patterns in the "Write Weightings" and "Read Weightings" suggest that the NTM is using a form of addressing mechanism to interact with its memory. The shift in the input and output patterns suggests a time-dependent transformation or processing of the data. The "Adds" and "Reads" heatmaps show how the NTM is modifying and retrieving information from its memory during the computation. The difference in activity between the "Adds" and "Reads" heatmaps may indicate a phase of writing followed by a phase of reading.