## Heatmap and Binary Matrix Diagram: Input-Output Weighting Analysis
### Overview
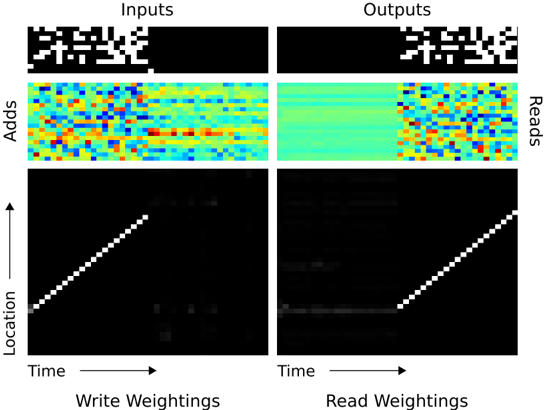
The image presents a comparative analysis of input/output processing through four quadrants:
1. **Inputs** (top-left): Binary matrix showing activation patterns
2. **Outputs** (top-right): Binary matrix showing response patterns
3. **Write Weightings** (bottom-left): Heatmap with color-coded temporal/location weighting
4. **Read Weightings** (bottom-right): Heatmap with color-coded temporal/location weighting
### Components/Axes
- **Axes**:
- Horizontal: "Time" (→)
- Vertical: "Location" (↑)
- **Legend**: No explicit legend present, but color gradients imply:
- **Write Weightings**: Blue (low) → Red (high) intensity
- **Read Weightings**: Blue (low) → Yellow (high) intensity
- **Binary Matrices**:
- White = Active/1
- Black = Inactive/0
### Detailed Analysis
1. **Inputs (Top-Left)**:
- Binary matrix with sparse white activations (≈15% of cells)
- Pattern: Clustered in upper-left quadrant, suggesting early temporal/location focus
2. **Outputs (Top-Right)**:
- Binary matrix with denser white activations (≈30% of cells)
- Pattern: Diagonal band from top-left to bottom-right, indicating sequential processing
3. **Write Weightings (Bottom-Left)**:
- Heatmap with gradient from blue (left) to red (right)
- Key feature: Diagonal white band (≈45° slope) with high-intensity red regions
- Temporal progression: Weighting increases along time axis
4. **Read Weightings (Bottom-Right)**:
- Heatmap with gradient from blue (left) to yellow (right)
- Key feature: Diagonal white band (≈30° slope) with high-intensity yellow regions
- Temporal progression: Weighting peaks later than write phase
### Key Observations
- **Temporal Correlation**: Write Weightings show earlier activation (steeper diagonal) vs. Read Weightings (shallower diagonal)
- **Spatial Focus**: Inputs concentrate in upper-left, Outputs spread diagonally across the matrix
- **Weighting Dynamics**: Write phase shows sharper spatial focus (red hotspots), while Read phase shows broader activation (yellow spread)
- **Uncertainty**: Exact numerical values cannot be determined without legend calibration
### Interpretation
The diagram illustrates a two-stage processing system:
1. **Input Encoding**: Sparse early activations (Inputs) are transformed through Write Weightings with strong temporal/location correlation
2. **Output Generation**: Read Weightings show delayed but broader activation patterns, suggesting integration of temporal information
3. **System Behavior**: The diagonal patterns in both weightings imply a causal relationship between time and location dimensions
4. **Anomaly**: The Output binary matrix's diagonal pattern doesn't perfectly align with Write Weightings' red hotspots, suggesting possible post-processing steps
The absence of explicit numerical values prevents quantitative analysis, but the visual patterns strongly indicate a sequential, time-dependent weighting mechanism with spatial localization characteristics.