## Line Chart: Model Performance by Graphwalks Method and Dataset Size
### Overview
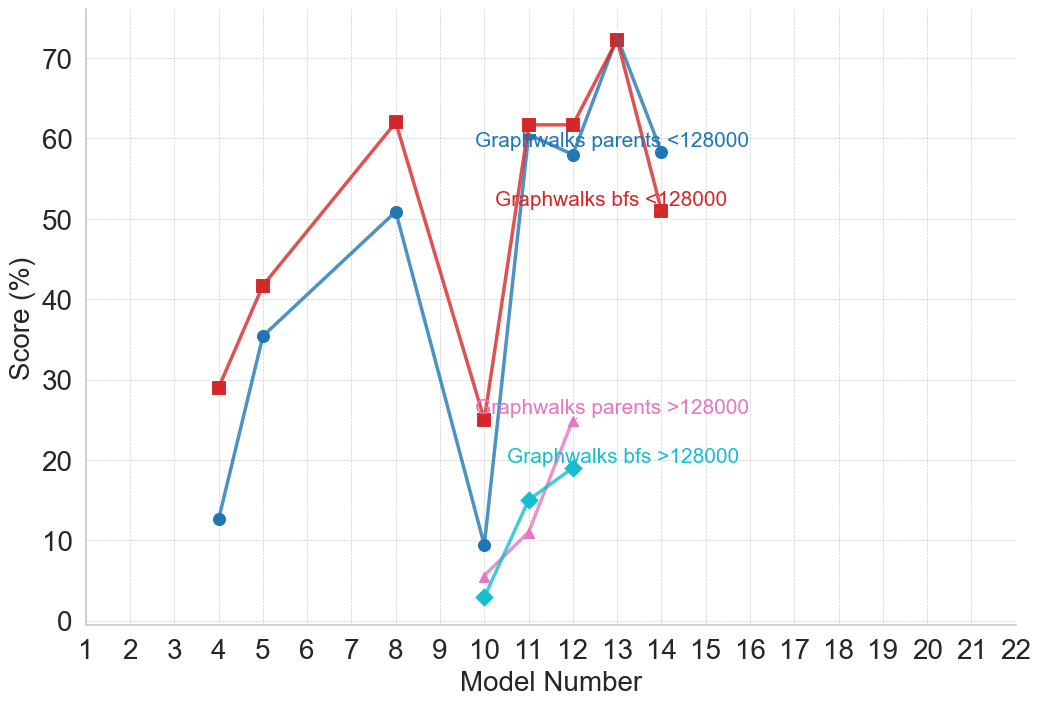
The image displays a line chart comparing the performance scores (in percentage) of different "Graphwalks" methods across a series of model numbers. The chart tracks four distinct data series, differentiated by color, marker shape, and the dataset size they represent (<128000 or >128000). The data suggests an evaluation of model performance on a task, with scores fluctuating significantly across model iterations.
### Components/Axes
* **X-Axis:** Labeled "Model Number". It is a linear scale with major tick marks and labels for every integer from 1 to 22.
* **Y-Axis:** Labeled "Score (%)". It is a linear scale with major tick marks and labels at intervals of 10, ranging from 0 to 70.
* **Legend:** There is no separate legend box. Instead, descriptive labels are placed directly on the chart area, color-coded to match their corresponding data lines. The labels are:
1. `Graphwalks parents <128000` (Blue text, positioned near the blue line's data point at Model 12).
2. `Graphwalks bfs <128000` (Red text, positioned near the red line's data point at Model 12).
3. `Graphwalks parents >128000` (Pink text, positioned near the pink line's data point at Model 11).
4. `Graphwalks bfs >128000` (Cyan/Teal text, positioned near the cyan line's data point at Model 12).
* **Data Series:** Four lines with distinct colors and markers:
* **Red line with square markers:** Corresponds to `Graphwalks bfs <128000`.
* **Blue line with circle markers:** Corresponds to `Graphwalks parents <128000`.
* **Pink line with triangle markers:** Corresponds to `Graphwalks parents >128000`.
* **Cyan/Teal line with diamond markers:** Corresponds to `Graphwalks bfs >128000`.
### Detailed Analysis
**1. `Graphwalks bfs <128000` (Red line, square markers)**
* **Trend:** Shows a volatile, generally upward trend until a peak, followed by a sharp decline. It is often the highest or second-highest scoring series.
* **Approximate Data Points:**
* Model 4: ~29%
* Model 5: ~42%
* Model 8: ~62%
* Model 10: ~25% (Significant drop)
* Model 11: ~62%
* Model 12: ~62%
* Model 13: ~72% (Peak of the entire chart)
* Model 14: ~51%
**2. `Graphwalks parents <128000` (Blue line, circle markers)**
* **Trend:** Follows a pattern very similar to the red `bfs <128000` line but generally scores slightly lower. It also peaks at Model 13.
* **Approximate Data Points:**
* Model 4: ~13%
* Model 5: ~35%
* Model 8: ~51%
* Model 10: ~10% (Significant drop)
* Model 11: ~60%
* Model 12: ~58%
* Model 13: ~72% (Matches the red line's peak)
* Model 14: ~58%
**3. `Graphwalks parents >128000` (Pink line, triangle markers)**
* **Trend:** This series only appears from Model 10 onward. It shows a steady, positive upward trend.
* **Approximate Data Points:**
* Model 10: ~5%
* Model 11: ~11%
* Model 12: ~25%
**4. `Graphwalks bfs >128000` (Cyan line, diamond markers)**
* **Trend:** This series also only appears from Model 10 onward. It shows a steady, positive upward trend, closely following but slightly below the pink `parents >128000` line.
* **Approximate Data Points:**
* Model 10: ~3%
* Model 11: ~15%
* Model 12: ~19%
### Key Observations
1. **Performance Cliff at Model 10:** Both methods (`bfs` and `parents`) for the smaller dataset (`<128000`) experience a dramatic performance drop at Model 10, falling from ~50-60% to ~10-25%.
2. **Peak Performance:** The highest score on the chart (~72%) is achieved by both the `bfs <128000` and `parents <128000` methods at Model 13.
3. **Dataset Size Impact:** For models 10-12, the methods applied to the larger dataset (`>128000`, pink and cyan lines) score significantly lower (3-25%) than their counterparts on the smaller dataset (10-62%). However, the `>128000` series show a consistent improving trend.
4. **Method Comparison (`bfs` vs. `parents`):** For the `<128000` dataset, the `bfs` method (red) generally outperforms or matches the `parents` method (blue), except at the final data point (Model 14) where `parents` scores higher. For the `>128000` dataset, the `parents` method (pink) consistently scores slightly higher than the `bfs` method (cyan).
5. **Data Sparsity:** The `>128000` series have far fewer data points (only Models 10, 11, 12) compared to the `<128000` series (Models 4, 5, 8, 10, 11, 12, 13, 14).
### Interpretation
This chart likely visualizes the results of an experiment testing different graph traversal algorithms (`bfs` - Breadth-First Search, and `parents` - possibly a parent-tracking variant) on models of increasing complexity or iteration (Model Number). The performance is measured as a percentage score on a specific task.
The data suggests several key insights:
* **Model 10 is a critical juncture.** The severe performance drop for the `<128000` dataset indicates a fundamental change in the model at this point—perhaps a architectural shift, a change in training data, or an increase in task difficulty that the existing methods struggled with initially.
* **Recovery and Optimization.** The strong rebound and peak at Model 13 for the `<128000` methods imply that subsequent model iterations successfully adapted to or overcame the challenge introduced at Model 10.
* **Scalability Challenge.** The consistently lower scores for the `>128000` dataset (larger graphs or more data) highlight a scalability issue. The methods perform worse when applied to larger-scale problems, though the upward trend from Models 10-12 shows potential for improvement with further model development.
* **Algorithmic Nuance.** The relative performance of `bfs` vs. `parents` is context-dependent. `bfs` appears more effective on the smaller, perhaps more constrained dataset, while `parents` shows a slight edge on the larger, more complex dataset. This could indicate that the `parents` method is more robust to scale.
In summary, the chart tells a story of model development facing a significant hurdle (Model 10), recovering strongly for one problem scale (`<128000`), while still working to effectively scale to larger problems (`>128000`). The choice between `bfs` and `parents` algorithms depends on the scale of the data being processed.