\n
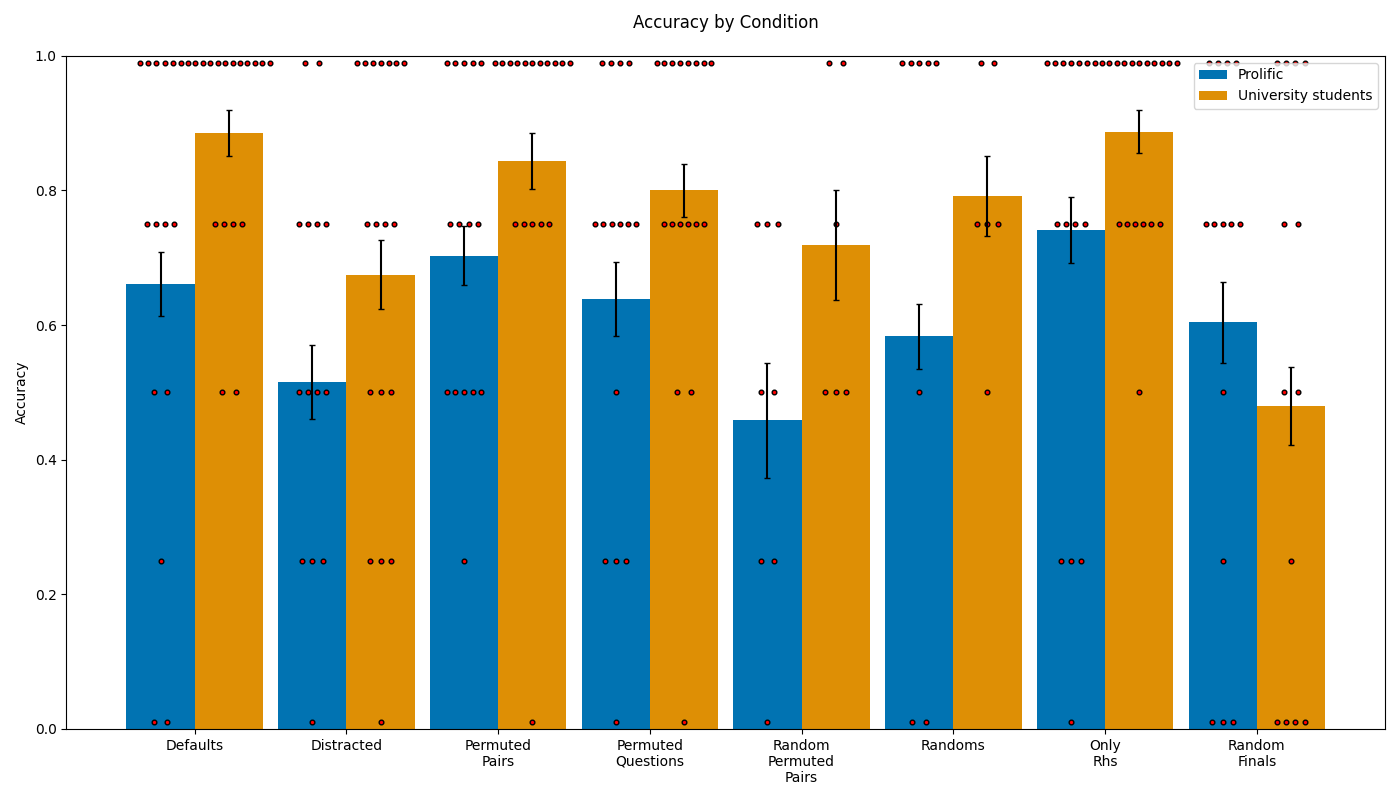
## Bar Chart: Accuracy by Condition
### Overview
This bar chart displays the accuracy scores for two groups – "Prolific" participants and "University students" – across eight different experimental conditions. Accuracy is represented on the y-axis, ranging from 0.0 to 1.0, while the x-axis lists the experimental conditions: Defaults, Distracted, Permuted Pairs, Permuted Questions, Random Permuted Pairs, Randoms, Only Rhs, and Random Finals. Each condition has two bars representing the accuracy of each group, with error bars indicating the variability within each group. Individual data points are overlaid as black dots.
### Components/Axes
* **Title:** Accuracy by Condition
* **Y-axis Label:** Accuracy (Scale: 0.0 to 1.0)
* **X-axis Labels (Conditions):** Defaults, Distracted, Permuted Pairs, Permuted Questions, Random Permuted Pairs, Randoms, Only Rhs, Random Finals
* **Legend:**
* Prolific (represented by a dotted blue line)
* University students (represented by a solid orange line)
### Detailed Analysis
The chart consists of eight sets of paired bars, one for each condition. Each pair represents the accuracy of Prolific participants (blue) and University students (orange). Error bars are present for each bar, indicating the standard error or confidence interval. Individual data points are scattered above each bar.
Here's a breakdown of the approximate accuracy values for each condition, based on the bar heights and overlaid data points:
* **Defaults:**
* Prolific: Approximately 0.72, with data points ranging from 0.1 to 0.9.
* University students: Approximately 0.78, with data points ranging from 0.2 to 0.9.
* **Distracted:**
* Prolific: Approximately 0.52, with data points ranging from 0.1 to 0.8.
* University students: Approximately 0.55, with data points ranging from 0.1 to 0.8.
* **Permuted Pairs:**
* Prolific: Approximately 0.74, with data points ranging from 0.2 to 0.9.
* University students: Approximately 0.85, with data points ranging from 0.2 to 1.0.
* **Permuted Questions:**
* Prolific: Approximately 0.62, with data points ranging from 0.1 to 0.9.
* University students: Approximately 0.82, with data points ranging from 0.2 to 0.9.
* **Random Permuted Pairs:**
* Prolific: Approximately 0.50, with data points ranging from 0.1 to 0.8.
* University students: Approximately 0.72, with data points ranging from 0.2 to 0.9.
* **Randoms:**
* Prolific: Approximately 0.60, with data points ranging from 0.2 to 0.9.
* University students: Approximately 0.80, with data points ranging from 0.2 to 0.9.
* **Only Rhs:**
* Prolific: Approximately 0.76, with data points ranging from 0.2 to 0.9.
* University students: Approximately 0.88, with data points ranging from 0.2 to 1.0.
* **Random Finals:**
* Prolific: Approximately 0.54, with data points ranging from 0.1 to 0.8.
* University students: Approximately 0.58, with data points ranging from 0.2 to 0.8.
### Key Observations
* University students generally exhibit higher accuracy scores than Prolific participants across most conditions.
* The "Distracted," "Random Permuted Pairs," and "Random Finals" conditions show the lowest accuracy for both groups.
* The "Permuted Pairs" and "Only Rhs" conditions show the highest accuracy, particularly for University students.
* The error bars suggest greater variability in accuracy for some conditions than others.
* The individual data points reveal some outliers in each condition.
### Interpretation
The data suggests that the experimental conditions significantly impact accuracy, and that University students consistently perform better than participants recruited through Prolific. The conditions involving randomization or distraction appear to be the most challenging, leading to lower accuracy scores. The higher accuracy in "Permuted Pairs" and "Only Rhs" might indicate that these conditions are more conducive to learning or recall. The spread of data points suggests individual differences in performance within each group. The difference in performance between the two groups could be due to differences in motivation, prior knowledge, or cognitive abilities. Further analysis would be needed to determine the underlying reasons for these observed patterns. The error bars provide a visual representation of the confidence in the mean accuracy for each group and condition. The presence of outliers suggests that some individuals may have performed significantly better or worse than the average.