## Box Plot: Number of Goals by Agent Type
### Overview
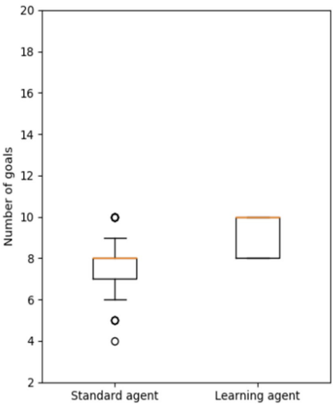
The image displays a comparative box plot analyzing the distribution of goals scored by two types of agents: "Standard agent" and "Learning agent". The y-axis represents the agent types, while the x-axis quantifies the "Number of goals" scored. The plot uses orange boxes to represent interquartile ranges (IQRs), black lines for medians and whiskers, and black circles for outliers.
### Components/Axes
- **X-axis (Horizontal)**:
- Label: "Number of goals"
- Scale: 2 to 20 (in increments of 2)
- Position: Bottom of the plot
- **Y-axis (Vertical)**:
- Categories: "Standard agent" (left) and "Learning agent" (right)
- Position: Left side of the plot
- **Legend**:
- No explicit legend present. Colors are inferred:
- Orange: Boxes (IQRs)
- Black: Medians, whiskers, and outliers
### Detailed Analysis
1. **Standard Agent**:
- **Median**: ~8 goals (black line within the orange box).
- **IQR**: 6 to 9 goals (orange box).
- **Whiskers**: Extend from ~6 (lower) to ~9 (upper).
- **Outliers**: Two data points outside the whiskers:
- Lower outlier: ~4 goals (black circle).
- Upper outlier: ~10 goals (black circle).
2. **Learning Agent**:
- **Median**: ~10 goals (black line within the orange box).
- **IQR**: 8 to 10 goals (orange box).
- **Whiskers**: Extend from ~8 (lower) to ~10 (upper).
- **Outliers**: None observed.
### Key Observations
- The **Learning agent** demonstrates a higher median goal count (~10) compared to the **Standard agent** (~8).
- The **Standard agent** exhibits greater variability, with a wider IQR (6–9) and outliers at 4 and 10 goals.
- The **Learning agent** shows a tighter distribution, with no outliers and a narrower IQR (8–10).
### Interpretation
The data suggests that the **Learning agent** consistently outperforms the **Standard agent** in goal-scoring, with a higher median and reduced variability. The **Standard agent**'s outliers (4 and 10 goals) indicate occasional anomalies, possibly due to unpredictable performance or edge cases. The absence of outliers in the Learning agent implies more stable and reliable performance. This could reflect the Learning agent's adaptive capabilities or optimized decision-making processes compared to the static nature of the Standard agent.