## Bar and Line Charts: KV Budget vs. Pass@1 and Throughput
### Overview
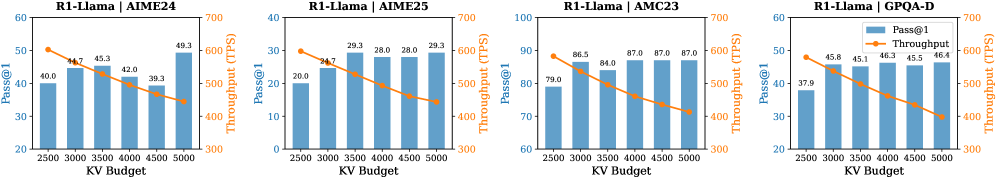
The image contains four separate bar and line charts, each displaying the relationship between KV Budget (x-axis), Pass@1 (left y-axis, blue bars), and Throughput (right y-axis, orange line). Each chart represents a different configuration: R1-Llama with AIME24, AIME25, AMC23, and GPQA-D. The KV Budget ranges from 2500 to 5000 in increments of 500.
### Components/Axes
* **Titles:** Each chart has a title in the format "R1-Llama | [Configuration Name]", where the configuration names are AIME24, AIME25, AMC23, and GPQA-D.
* **X-Axis:** KV Budget, with values 2500, 3000, 3500, 4000, 4500, and 5000.
* **Left Y-Axis:** Pass@1, ranging from 0 to 60 (AIME25), 0 to 100 (AMC23), and 20 to 60 (AIME24, GPQA-D).
* **Right Y-Axis:** Throughput (TPS), ranging from 300 to 700 for all charts.
* **Legend:** Located in the top-right chart (R1-Llama | GPQA-D), indicating that blue bars represent "Pass@1" and the orange line represents "Throughput".
### Detailed Analysis
**Chart 1: R1-Llama | AIME24**
* **Pass@1 (Blue Bars):** The values increase with KV Budget: 40.0, 44.7, 45.3, 42.0, 39.3, 49.3.
* **Throughput (Orange Line):** The values decrease with KV Budget: approximately 50, 45, 42, 41, 38, 36.
**Chart 2: R1-Llama | AIME25**
* **Pass@1 (Blue Bars):** The values increase with KV Budget: 20.0, 29.3, 28.0, 28.0, 29.3.
* **Throughput (Orange Line):** The values decrease with KV Budget: approximately 30, 25, 24, 23, 22, 21.
**Chart 3: R1-Llama | AMC23**
* **Pass@1 (Blue Bars):** The values increase with KV Budget: 79.0, 86.5, 84.0, 87.0, 87.0, 87.0.
* **Throughput (Orange Line):** The values decrease with KV Budget: approximately 88, 83, 79, 76, 73, 71.
**Chart 4: R1-Llama | GPQA-D**
* **Pass@1 (Blue Bars):** The values increase with KV Budget: 37.9, 45.8, 45.1, 46.3, 45.5, 46.4.
* **Throughput (Orange Line):** The values decrease with KV Budget: approximately 48, 45, 43, 42, 41, 40.
### Key Observations
* Across all configurations, Pass@1 generally increases with KV Budget, although there are some fluctuations.
* Throughput consistently decreases with increasing KV Budget.
* The AMC23 configuration has the highest Pass@1 values, while AIME25 has the lowest.
### Interpretation
The charts suggest a trade-off between Pass@1 and Throughput when adjusting the KV Budget for the R1-Llama model. Increasing the KV Budget generally improves the Pass@1 metric, indicating better accuracy or performance on a specific task. However, this comes at the cost of reduced Throughput, meaning the model processes fewer transactions or inferences per second.
The different configurations (AIME24, AIME25, AMC23, GPQA-D) likely represent different datasets or training parameters. The varying Pass@1 values across these configurations indicate that the model's performance is sensitive to the specific data or training setup used. The consistent inverse relationship between Pass@1 and Throughput suggests a fundamental constraint in the model's architecture or resource allocation.
Further investigation would be needed to understand the specific nature of the tasks being performed and the reasons for the observed trade-off. It would also be beneficial to explore other configurations or optimization techniques to potentially improve both Pass@1 and Throughput simultaneously.