\n
## Bar Charts with Overlaid Line Graphs: R1-Llama Performance Across Benchmarks
### Overview
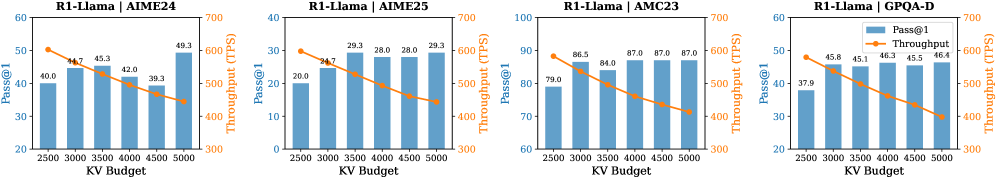
The image displays four horizontally arranged composite charts. Each chart is a dual-axis graph combining a bar chart and a line graph to visualize the performance of a model named "R1-Llama" on four different benchmarks: AIME24, AIME25, AMC23, and GPQA-D. The charts analyze the relationship between "KV Budget" (x-axis) and two performance metrics: "Pass@1" (left y-axis, represented by blue bars) and "Throughput (TPS)" (right y-axis, represented by an orange line with markers).
### Components/Axes
* **Titles (Top of each chart, from left to right):**
1. `R1-Llama | AIME24`
2. `R1-Llama | AIME25`
3. `R1-Llama | AMC23`
4. `R1-Llama | GPQA-D`
* **X-Axis (Common to all charts):**
* **Label:** `KV Budget`
* **Ticks/Values:** 2500, 3000, 3500, 4000, 4500, 5000.
* **Primary Y-Axis (Left side, for bars):**
* **Label:** `Pass@1`
* **Scale:** Varies per chart (see Detailed Analysis).
* **Secondary Y-Axis (Right side, for line):**
* **Label:** `Throughput (TPS)`
* **Scale:** 300 to 700 for all charts.
* **Legend (Located in the top-right corner of the fourth chart - GPQA-D):**
* A blue square labeled `Pass@1`.
* An orange line with a circle marker labeled `Throughput`.
### Detailed Analysis
**Chart 1: R1-Llama | AIME24**
* **Pass@1 (Blue Bars):** The left y-axis ranges from 20 to 60. The bars show a general upward trend with some fluctuation.
* KV 2500: ~40.0
* KV 3000: ~44.7
* KV 3500: ~45.3
* KV 4000: ~42.0
* KV 4500: ~39.3
* KV 5000: ~49.3
* **Throughput (Orange Line):** The line shows a clear, steady downward trend.
* KV 2500: ~600 TPS
* KV 3000: ~570 TPS
* KV 3500: ~540 TPS
* KV 4000: ~510 TPS
* KV 4500: ~480 TPS
* KV 5000: ~450 TPS
**Chart 2: R1-Llama | AIME25**
* **Pass@1 (Blue Bars):** The left y-axis ranges from 0 to 40. The bars show a general upward trend.
* KV 2500: ~20.0
* KV 3000: ~24.7
* KV 3500: ~29.3
* KV 4000: ~28.0
* KV 4500: ~28.0
* KV 5000: ~29.3
* **Throughput (Orange Line):** The line shows a clear, steady downward trend.
* KV 2500: ~600 TPS
* KV 3000: ~570 TPS
* KV 3500: ~540 TPS
* KV 4000: ~510 TPS
* KV 4500: ~480 TPS
* KV 5000: ~450 TPS
**Chart 3: R1-Llama | AMC23**
* **Pass@1 (Blue Bars):** The left y-axis ranges from 60 to 100. The bars show a general upward trend, plateauing at higher KV budgets.
* KV 2500: ~79.0
* KV 3000: ~86.5
* KV 3500: ~84.0
* KV 4000: ~87.0
* KV 4500: ~87.0
* KV 5000: ~87.0
* **Throughput (Orange Line):** The line shows a clear, steady downward trend.
* KV 2500: ~600 TPS
* KV 3000: ~570 TPS
* KV 3500: ~540 TPS
* KV 4000: ~510 TPS
* KV 4500: ~480 TPS
* KV 5000: ~450 TPS
**Chart 4: R1-Llama | GPQA-D**
* **Pass@1 (Blue Bars):** The left y-axis ranges from 20 to 60. The bars show a general upward trend.
* KV 2500: ~37.9
* KV 3000: ~45.8
* KV 3500: ~45.1
* KV 4000: ~46.3
* KV 4500: ~45.5
* KV 5000: ~46.4
* **Throughput (Orange Line):** The line shows a clear, steady downward trend.
* KV 2500: ~600 TPS
* KV 3000: ~570 TPS
* KV 3500: ~540 TPS
* KV 4000: ~510 TPS
* KV 4500: ~480 TPS
* KV 5000: ~450 TPS
### Key Observations
1. **Consistent Inverse Relationship:** Across all four benchmarks, there is a clear and consistent inverse relationship between the two metrics. As the KV Budget increases, the model's **Throughput (TPS) decreases linearly**.
2. **Variable Pass@1 Response:** The model's **Pass@1 accuracy** generally improves or plateaus with increased KV Budget, but the pattern is less uniform than throughput. The improvement is most pronounced in the AIME24 and AIME25 benchmarks. The AMC23 benchmark shows a performance plateau after KV=4000.
3. **Benchmark Difficulty:** The absolute Pass@1 values suggest varying difficulty among the benchmarks. AMC23 appears to be the easiest for this model (scores ~80-87), while AIME25 appears the most challenging (scores ~20-29).
4. **Throughput Uniformity:** The throughput line is virtually identical in slope and value across all four charts, suggesting that the computational cost (in terms of TPS) of processing a given KV Budget is independent of the specific benchmark task.
### Interpretation
This data demonstrates a fundamental **trade-off between computational efficiency (Throughput) and model performance (Pass@1 accuracy)** when scaling the KV Budget for the R1-Llama model.
* **The Trade-off:** Increasing the KV Budget allows the model to process more context or use more complex reasoning, which generally leads to better accuracy on knowledge-intensive and reasoning benchmarks (AIME, GPQA). However, this comes at a direct and predictable cost to speed, as measured by Tokens Per Second.
* **Peircean Insight (Reading Between the Lines):** The near-identical throughput lines across different tasks imply that the KV Budget's impact on system performance is a **hardware or architecture-bound constraint**, not a task-dependent one. The variation in Pass@1 trends, however, is **task-dependent**. This suggests that while you can predict the speed penalty of increasing KV Budget, the accuracy benefit is highly contingent on the nature of the problem. For some tasks (like AMC23), there's a point of diminishing returns where adding more KV Budget no longer improves accuracy but continues to slow down the system.
* **Practical Implication:** A user or engineer must choose an operating point on the KV Budget axis based on their priority. For real-time applications where speed is critical, a lower KV Budget (e.g., 2500-3000) is preferable. For offline analysis or tasks where accuracy is paramount, a higher KV Budget (e.g., 4500-5000) can be justified despite the lower throughput. The optimal point likely varies by benchmark, as shown by the different Pass@1 curves.