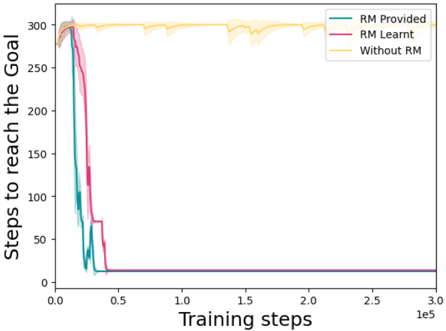
## Line Chart: Steps to Reach the Goal
### Overview
The chart compares the performance of three approaches in reaching a goal over training steps: "RM Provided," "RM Learnt," and "Without RM." The y-axis measures the number of steps required to reach the goal, while the x-axis represents training steps up to 300,000 (3.0e5). All three lines show a sharp decline in steps to reach the goal at the start of training, followed by stabilization.
### Components/Axes
- **X-axis (Training steps)**: Logarithmic scale from 0.0 to 3.0e5 (300,000).
- **Y-axis (Steps to reach the Goal)**: Linear scale from 0 to 300.
- **Legend**: Located in the top-right corner, with three entries:
- **RM Provided**: Teal line.
- **RM Learnt**: Pink line.
- **Without RM**: Yellow line.
- **Shaded Regions**: Confidence intervals (error margins) around each line.
### Detailed Analysis
1. **RM Provided (Teal)**:
- Starts at ~300 steps at 0.0 training steps.
- Drops sharply to near 0 steps by ~0.5e5 training steps.
- Remains flat at ~0 steps for the remainder of training.
- Confidence interval is narrow after the initial drop, indicating consistent performance.
2. **RM Learnt (Pink)**:
- Starts at ~300 steps at 0.0 training steps.
- Drops sharply to near 0 steps by ~0.5e5 training steps, slightly delayed compared to "RM Provided."
- Remains flat at ~0 steps for the remainder of training.
- Confidence interval is slightly wider than "RM Provided" but stabilizes quickly.
3. **Without RM (Yellow)**:
- Starts at ~300 steps at 0.0 training steps.
- Remains flat at ~300 steps for the entire training period.
- Confidence interval is wide, indicating high variability in performance.
### Key Observations
- **Sharp Initial Drop**: Both "RM Provided" and "RM Learnt" achieve near-zero steps to reach the goal within ~0.5e5 training steps, suggesting rapid convergence.
- **Baseline Underperformance**: "Without RM" fails to reduce steps to reach the goal, maintaining ~300 steps throughout training.
- **Confidence Intervals**: "RM Provided" and "RM Learnt" show tight confidence intervals after the initial drop, while "Without RM" has wide intervals, reflecting instability.
### Interpretation
The data demonstrates that reward models (RM) significantly accelerate goal achievement compared to training without them. "RM Provided" and "RM Learnt" both outperform the baseline by orders of magnitude, with "RM Provided" showing marginally faster convergence. The slight delay in "RM Learnt" may reflect the time required for the reward model to learn effective policies. The consistency of "RM Provided" suggests pre-trained reward models are more reliable than learned ones during early training phases. The absence of RM results in no improvement, highlighting its critical role in optimizing training efficiency.