## Scatter Plot: Complexity vs. Links
### Overview
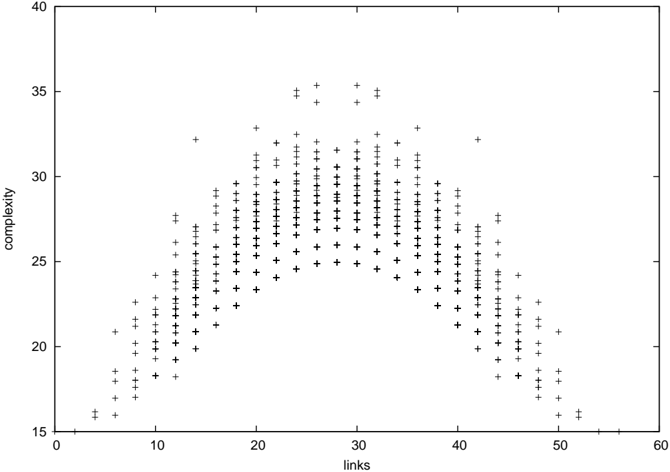
The image is a scatter plot showing the relationship between "complexity" (y-axis) and "links" (x-axis). The data points are represented by '+' symbols. The plot shows an inverted U-shaped distribution, where complexity increases with links up to a certain point, then decreases as links increase further.
### Components/Axes
* **X-axis:** "links", ranging from 0 to 60, with tick marks at intervals of 10 (0, 10, 20, 30, 40, 50, 60).
* **Y-axis:** "complexity", ranging from 15 to 40, with tick marks at intervals of 5 (15, 20, 25, 30, 35, 40).
* **Data Points:** Represented by '+' symbols.
### Detailed Analysis
* **Trend:** The data points form an inverted U-shape.
* From links = 0 to approximately links = 30, the complexity generally increases.
* From links = 30 to links = 60, the complexity generally decreases.
* **Specific Values (Approximate):**
* At links = 5, complexity ranges from approximately 16 to 22.
* At links = 10, complexity ranges from approximately 17 to 24.
* At links = 15, complexity ranges from approximately 20 to 28.
* At links = 20, complexity ranges from approximately 23 to 31.
* At links = 25, complexity ranges from approximately 25 to 35.
* At links = 30, complexity ranges from approximately 25 to 36.
* At links = 35, complexity ranges from approximately 25 to 33.
* At links = 40, complexity ranges from approximately 22 to 30.
* At links = 45, complexity ranges from approximately 19 to 27.
* At links = 50, complexity ranges from approximately 17 to 23.
* At links = 55, complexity ranges from approximately 16 to 20.
### Key Observations
* The highest complexity values are observed around links = 30.
* The spread of complexity values is wider in the middle range of links (approximately 15 to 45) compared to the extreme ends.
* There appears to be a degree of symmetry in the distribution around links = 30.
### Interpretation
The scatter plot suggests that there is a non-linear relationship between the number of links and complexity. Complexity increases as the number of links increases, up to a certain point (around 30 links), after which complexity decreases as the number of links continues to increase. This could indicate that there is an optimal number of links for maximizing complexity, and that beyond this point, adding more links may actually reduce complexity. The spread of data points suggests that there is variability in complexity for any given number of links.