## Line Chart: Off-policy GRPO Performance
### Overview
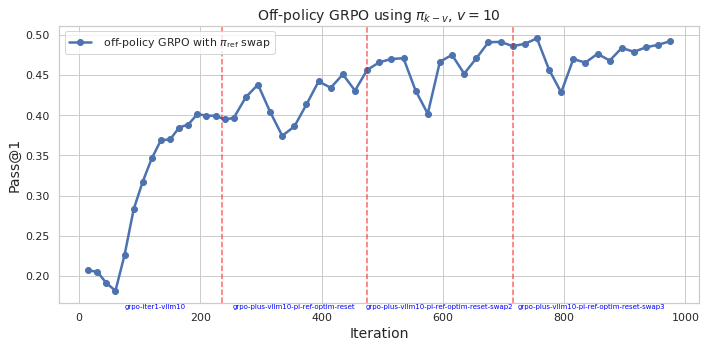
This image displays a line chart tracking the performance of an "Off-policy GRPO" (Group Relative Policy Optimization) model over 1,000 training iterations. The Y-axis measures "Pass@1" (a common metric for code generation or reasoning tasks), while the X-axis represents the iteration count. The chart illustrates a general upward trend in performance, punctuated by specific configuration changes marked by vertical red lines.
### Components/Axes
* **Title:** "Off-policy GRPO using $\pi_{k-v}, v = 10$"
* **Y-Axis:** Labeled "Pass@1", with a scale ranging from 0.20 to 0.50 in increments of 0.05.
* **X-Axis:** Labeled "Iteration", with a scale ranging from 0 to 1000 in increments of 200.
* **Legend:** Located in the top-left corner, identifying the blue line with circular markers as "off-policy GRPO with $\pi_{ref}$ swap".
* **Vertical Markers:** Three dashed red vertical lines are positioned at approximately iteration 230, 530, and 710.
* **Annotations (Bottom):** Small blue text labels are placed along the bottom of the chart, indicating specific configuration states:
* `grpo-iter1-vllm10` (Start)
* `grpo-plus-vllm10-pi-ref-optim-reset` (Between 230 and 530)
* `grpo-plus-vllm10-pi-ref-optim-reset-swap2` (Between 530 and 710)
* `grpo-plus-vllm10-pi-ref-optim-reset-swap3` (After 710)
### Detailed Analysis
The data series is a single blue line with circular markers representing data points.
**Trend Verification:**
1. **Initial Phase (0–230):** The line starts at approximately 0.21, dips to 0.18 at iteration 50, then climbs steeply to reach 0.40 by iteration 200.
2. **First Intervention (230–530):** After the first red line (x=230), the performance dips slightly to 0.39, then trends upward, reaching a local peak of approximately 0.45 at iteration 500.
3. **Second Intervention (530–710):** After the second red line (x=530), there is a sharp drop to 0.40. Following this, the model recovers and climbs to approximately 0.47 by iteration 680.
4. **Third Intervention (710–1000):** After the third red line (x=710), the performance dips slightly to 0.48, then continues a gradual upward trend, ending near 0.495 at iteration 980.
### Key Observations
* **Performance Recovery:** Every vertical red line (representing a "reset" or "swap" configuration change) is immediately followed by a short-term dip in performance, which is then consistently followed by a recovery to a higher performance level than before the intervention.
* **Diminishing Returns:** While the model continues to improve, the rate of improvement slows down as the Pass@1 metric approaches 0.50.
* **Volatility:** The model exhibits higher volatility (larger swings) in the middle of the training process (iterations 300–600) compared to the final phase (iterations 800–1000).
### Interpretation
This chart demonstrates the efficacy of a "swap" strategy in Off-policy GRPO training. The "swaps" (likely updating the reference policy $\pi_{ref}$ to the current policy) act as a regularization or stabilization technique.
The pattern suggests that the model reaches a performance plateau, at which point the configuration is "reset" or "swapped." While this causes a temporary drop in accuracy (likely due to the model adjusting to the new reference policy), it successfully breaks the plateau, allowing the model to reach a new, higher performance ceiling. This is a classic "sawtooth" optimization pattern often seen in reinforcement learning where periodic policy updates are required to maintain stability and continue learning.