## Chart Type: Line Graphs Comparing Model Performance on Question Answering Tasks
### Overview
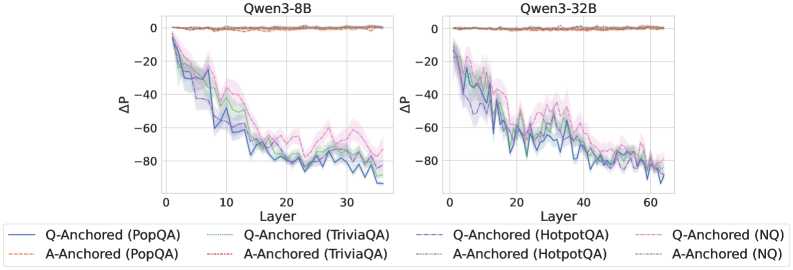
The image contains two line graphs comparing the performance of two language models, Qwen3-8B and Qwen3-32B, on various question-answering tasks. The graphs plot the change in performance (ΔP) across different layers of the model. Each line represents a different question-answering dataset, with separate lines for question-anchored (Q-Anchored) and answer-anchored (A-Anchored) approaches.
### Components/Axes
* **Titles:**
* Left Graph: Qwen3-8B
* Right Graph: Qwen3-32B
* **X-axis:** Layer (Number of layers in the model)
* Left Graph: Scale from 0 to 30, with ticks at approximately 0, 10, 20, and 30.
* Right Graph: Scale from 0 to 60, with ticks at approximately 0, 20, 40, and 60.
* **Y-axis:** ΔP (Change in Performance)
* Scale from -80 to 0, with ticks at -80, -60, -40, -20, and 0.
* **Legend:** Located at the bottom of the image, spanning both graphs.
* **Q-Anchored (PopQA):** Solid blue line
* **A-Anchored (PopQA):** Dashed brown line
* **Q-Anchored (TriviaQA):** Dotted green line
* **A-Anchored (TriviaQA):** Dotted-dashed grey line
* **Q-Anchored (HotpotQA):** Solid light-green line
* **A-Anchored (HotpotQA):** Dashed light-brown line
* **Q-Anchored (NQ):** Dotted-dashed pink line
* **A-Anchored (NQ):** Dotted-dashed grey line
### Detailed Analysis
**Left Graph (Qwen3-8B):**
* **Q-Anchored (PopQA):** (Solid Blue) Starts at approximately -20 and decreases to approximately -80 by layer 30.
* **A-Anchored (PopQA):** (Dashed Brown) Remains relatively constant around 0 across all layers.
* **Q-Anchored (TriviaQA):** (Dotted Green) Starts at approximately -20 and decreases to approximately -70 by layer 30.
* **A-Anchored (TriviaQA):** (Dotted-Dashed Grey) Starts at approximately -20 and decreases to approximately -70 by layer 30.
* **Q-Anchored (HotpotQA):** (Solid Light-Green) Starts at approximately -20 and decreases to approximately -70 by layer 30.
* **A-Anchored (HotpotQA):** (Dashed Light-Brown) Remains relatively constant around 0 across all layers.
* **Q-Anchored (NQ):** (Dotted-Dashed Pink) Starts at approximately -20 and decreases to approximately -70 by layer 30.
* **A-Anchored (NQ):** (Dotted-Dashed Grey) Starts at approximately -20 and decreases to approximately -70 by layer 30.
**Right Graph (Qwen3-32B):**
* **Q-Anchored (PopQA):** (Solid Blue) Starts at approximately -20 and decreases to approximately -80 by layer 60.
* **A-Anchored (PopQA):** (Dashed Brown) Remains relatively constant around 0 across all layers.
* **Q-Anchored (TriviaQA):** (Dotted Green) Starts at approximately -20 and decreases to approximately -70 by layer 60.
* **A-Anchored (TriviaQA):** (Dotted-Dashed Grey) Starts at approximately -20 and decreases to approximately -70 by layer 60.
* **Q-Anchored (HotpotQA):** (Solid Light-Green) Starts at approximately -20 and decreases to approximately -70 by layer 60.
* **A-Anchored (HotpotQA):** (Dashed Light-Brown) Remains relatively constant around 0 across all layers.
* **Q-Anchored (NQ):** (Dotted-Dashed Pink) Starts at approximately -20 and decreases to approximately -70 by layer 60.
* **A-Anchored (NQ):** (Dotted-Dashed Grey) Starts at approximately -20 and decreases to approximately -70 by layer 60.
### Key Observations
* The performance (ΔP) of Q-Anchored methods generally decreases as the layer number increases for both models.
* The performance (ΔP) of A-Anchored (PopQA) and A-Anchored (HotpotQA) methods remains relatively constant around 0 across all layers for both models.
* The Qwen3-32B model has twice as many layers as the Qwen3-8B model (60 vs 30).
* The trends in performance change are similar for both models across the different question-answering datasets.
### Interpretation
The data suggests that increasing the number of layers in the Qwen3 models negatively impacts the performance of question-anchored methods on the tested question-answering tasks. The answer-anchored methods, specifically PopQA and HotpotQA, appear to be less sensitive to the number of layers. This could indicate that question-anchoring becomes more challenging as the model depth increases, possibly due to issues like vanishing gradients or increased complexity in processing the question. The A-Anchored methods are not impacted by the number of layers. The similarity in trends between the two models suggests that the observed behavior is consistent across different model sizes within the Qwen3 family. The shaded regions around the lines likely represent the standard deviation or confidence intervals, indicating the variability in performance across different runs or data samples.