\n
## Bar Chart: Exact Match (%) vs. SFT Data Ratio
### Overview
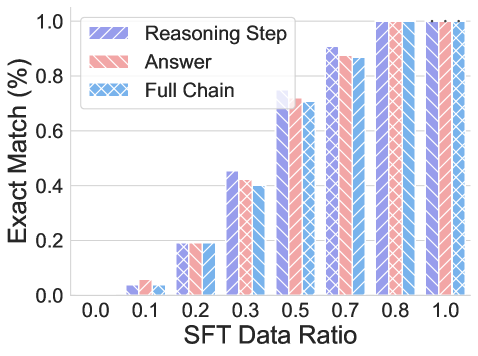
This bar chart displays the relationship between the SFT (Supervised Fine-Tuning) Data Ratio and the Exact Match (%) for three different components: Reasoning Step, Answer, and Full Chain. The chart uses grouped bar representations to compare the Exact Match percentages for each component at different SFT Data Ratios.
### Components/Axes
* **X-axis:** SFT Data Ratio, with markers at 0.1, 0.2, 0.3, 0.5, 0.7, 0.8, and 1.0.
* **Y-axis:** Exact Match (%), ranging from 0.0 to 1.0.
* **Legend:**
* Reasoning Step (Light Blue, hatched bars)
* Answer (Light Red, hatched bars)
* Full Chain (Medium Blue, hatched bars)
### Detailed Analysis
The chart consists of seven groups of three bars, each corresponding to a specific SFT Data Ratio.
* **SFT Data Ratio = 0.1:**
* Reasoning Step: Approximately 0.04 Exact Match.
* Answer: Approximately 0.01 Exact Match.
* Full Chain: Approximately 0.02 Exact Match.
* **SFT Data Ratio = 0.2:**
* Reasoning Step: Approximately 0.16 Exact Match.
* Answer: Approximately 0.08 Exact Match.
* Full Chain: Approximately 0.12 Exact Match.
* **SFT Data Ratio = 0.3:**
* Reasoning Step: Approximately 0.42 Exact Match.
* Answer: Approximately 0.40 Exact Match.
* Full Chain: Approximately 0.41 Exact Match.
* **SFT Data Ratio = 0.5:**
* Reasoning Step: Approximately 0.70 Exact Match.
* Answer: Approximately 0.68 Exact Match.
* Full Chain: Approximately 0.69 Exact Match.
* **SFT Data Ratio = 0.7:**
* Reasoning Step: Approximately 0.86 Exact Match.
* Answer: Approximately 0.83 Exact Match.
* Full Chain: Approximately 0.85 Exact Match.
* **SFT Data Ratio = 0.8:**
* Reasoning Step: Approximately 0.96 Exact Match.
* Answer: Approximately 0.94 Exact Match.
* Full Chain: Approximately 0.95 Exact Match.
* **SFT Data Ratio = 1.0:**
* Reasoning Step: Approximately 0.98 Exact Match.
* Answer: Approximately 0.96 Exact Match.
* Full Chain: Approximately 0.97 Exact Match.
All three data series (Reasoning Step, Answer, and Full Chain) exhibit a clear upward trend as the SFT Data Ratio increases. The Reasoning Step consistently shows the highest Exact Match percentage, followed closely by the Full Chain, and then the Answer.
### Key Observations
* The Exact Match percentage increases significantly with increasing SFT Data Ratio for all three components.
* The Reasoning Step consistently outperforms the Answer and Full Chain in terms of Exact Match.
* The differences between the Exact Match percentages of the three components become smaller as the SFT Data Ratio approaches 1.0.
### Interpretation
The data suggests a strong positive correlation between the amount of Supervised Fine-Tuning (SFT) data used and the accuracy (as measured by Exact Match) of the Reasoning Step, Answer, and Full Chain components. This indicates that increasing the amount of labeled data used for fine-tuning improves the performance of the model in all three areas. The consistently higher performance of the Reasoning Step suggests that this component benefits the most from SFT, or that it is inherently more accurate than the other two. The convergence of the Exact Match percentages at higher SFT Data Ratios implies that all components reach a performance plateau with sufficient training data. This chart is valuable for understanding the impact of data quantity on model performance and for guiding decisions about data collection and model training strategies.