\n
## Diagram: Causal Inference Process
### Overview
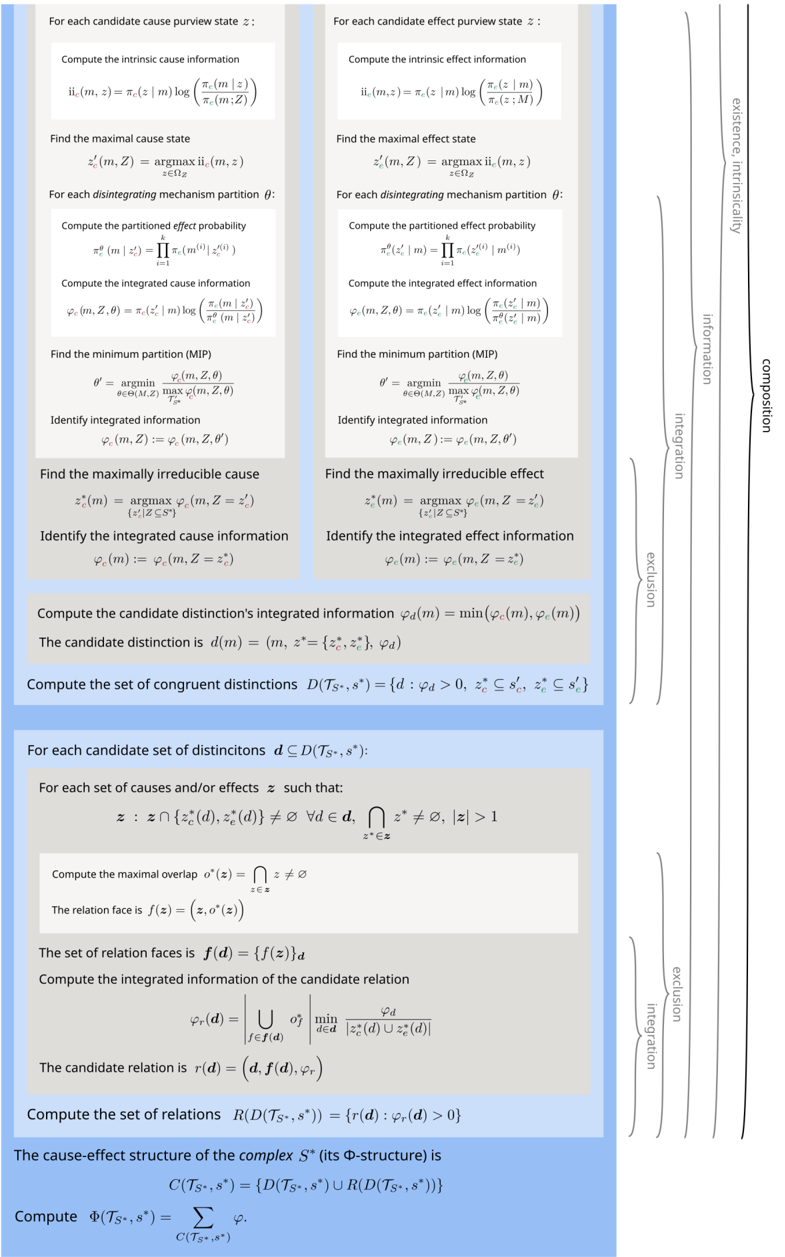
The image presents a diagram outlining a process for causal inference, broken down into four main stages: prediction, composition, association, and intervention. Each stage is further divided into several steps, described as mathematical operations and logical flows. The diagram is structured as two parallel columns, likely representing a forward and reverse perspective of the same process. A color-coded vertical bar on the right side visually categorizes the stages.
### Components/Axes
The diagram consists of a series of text blocks arranged in a vertical flow. There are no explicit axes or scales. The stages are labeled as follows (from top to bottom):
1. **Prediction** (light blue)
2. **Composition** (light green)
3. **Association** (light orange)
4. **Intervention** (light red)
Each stage contains several steps, each described with mathematical notation. The diagram is split into two columns, with identical stages mirrored on each side.
### Detailed Analysis or Content Details
**Left Column:**
* **Prediction:**
* Compute the intrinsic cause information: `i(m, z) = -π(z|m) log(π(z|m))`
* Find the maximal cause state: `z*(m, Z) = argmax_{z ∈ Z} i(m, z)`
* **Composition:**
* Compute the partitioned effect probability: `π*(z|m) = Π_{i=1}^d π(z_i|m)`
* Compute the integrated cause information: `φ(m, z) = -π*(z|m) log(π*(z|m))`
* **Association:**
* Find the minimum partition (MIP): `θ* = argmin_{θ ∈ Θ} Σ_{i=1}^d π(z_i|m, θ)`
* Identify integrated information: `φ(m, z, θ*)`
* **Intervention:**
* Find the maximally irreducible cause: `z*(m) = argmax_{z ∈ Z} φ(m, z)`
* Compute the relational information: `Γ(m, z*) = min_{m’ ∈ M} φ(m’, z*)`
* Find the total interventional effect: `δ(m, z*) = φ(m, z*) - Γ(m, z*)`
**Right Column:**
* **Prediction:**
* Compute the intrinsic effect information: `ii(m, z) = -π(z|m) log(π(z|m))`
* Find the maximal effect state: `z*(m, Z) = argmax_{z ∈ Z} ii(m, z)`
* **Composition:**
* Compute the partitioned effect probability: `π*(z|m) = Π_{i=1}^d π(z_i|m)`
* Compute the integrated effect information: `φ(m, z) = -π*(z|m) log(π*(z|m))`
* **Association:**
* Find the minimum partition (MIP): `θ* = argmin_{θ ∈ Θ} Σ_{i=1}^d π(z_i|m, θ)`
* Identify integrated information: `φ(m, z, θ*)`
* **Intervention:**
* Find the maximally irreducible effect: `z*(m) = argmax_{z ∈ Z} φ(m, z)`
* Compute the maximal overlap: `η = max_{z ∈ Z} φ(m, z)`
* Compute the total interventional effect: `δ(m, z*) = φ(m, z*) - η`
**Footer:**
* The diagram includes the text: "The causal model: M = (M, π, Z)"
* The text "For each set of causes and/or effects z such that:" is present.
* The text "Compute the set of congruent distinctions D*(T) = {d : p_i(d) > 0, Σ_{i=1}^d < δ}" is present.
* The text "For each candidate set of distinctions d ∈ D(T)s, for each:" is present.
* The text "Maximize Γ(m, z*) for z* ∈ Z" is present.
### Key Observations
The diagram presents a highly mathematical and abstract process. The mirrored structure suggests a duality or inverse relationship between cause and effect. The use of mathematical notation (log, argmax, summation) indicates a quantitative approach to causal inference. The color-coding helps to visually separate the different stages of the process. The footer text suggests a formal definition of the causal model and a process for identifying congruent distinctions.
### Interpretation
This diagram outlines a formal framework for causal inference, likely rooted in information theory or statistical mechanics. The process appears to aim at identifying the "maximally irreducible" cause or effect, and quantifying the interventional effect of manipulating a cause. The use of partitioned probabilities and integrated information suggests an attempt to decompose complex systems into simpler causal components. The mirrored structure implies that the same mathematical principles apply to both identifying causes and predicting effects. The diagram is not about a specific domain, but rather a general methodology for causal reasoning. The mathematical notation and abstract concepts suggest this is intended for a highly technical audience with a strong background in statistics, information theory, or related fields. The diagram is a theoretical model, and its practical application would likely require significant computational resources and domain-specific knowledge.