TECHNICAL ASSET FINGERPRINT
aee0a3246c71ef5d4ea042c6
Click to view fullscreen
Press ESC or click to close
FOUND IN PAPERS
EXPERT: gemini-2.5-flash-free VERSION 1
RUNTIME: google-free/gemini-2.5-flash
INTEL_VERIFIED
## Chart Type: Mean Pass Rate vs. Mean Number of Tokens Generated with `n_p` and `n_fr` Parameters
### Overview
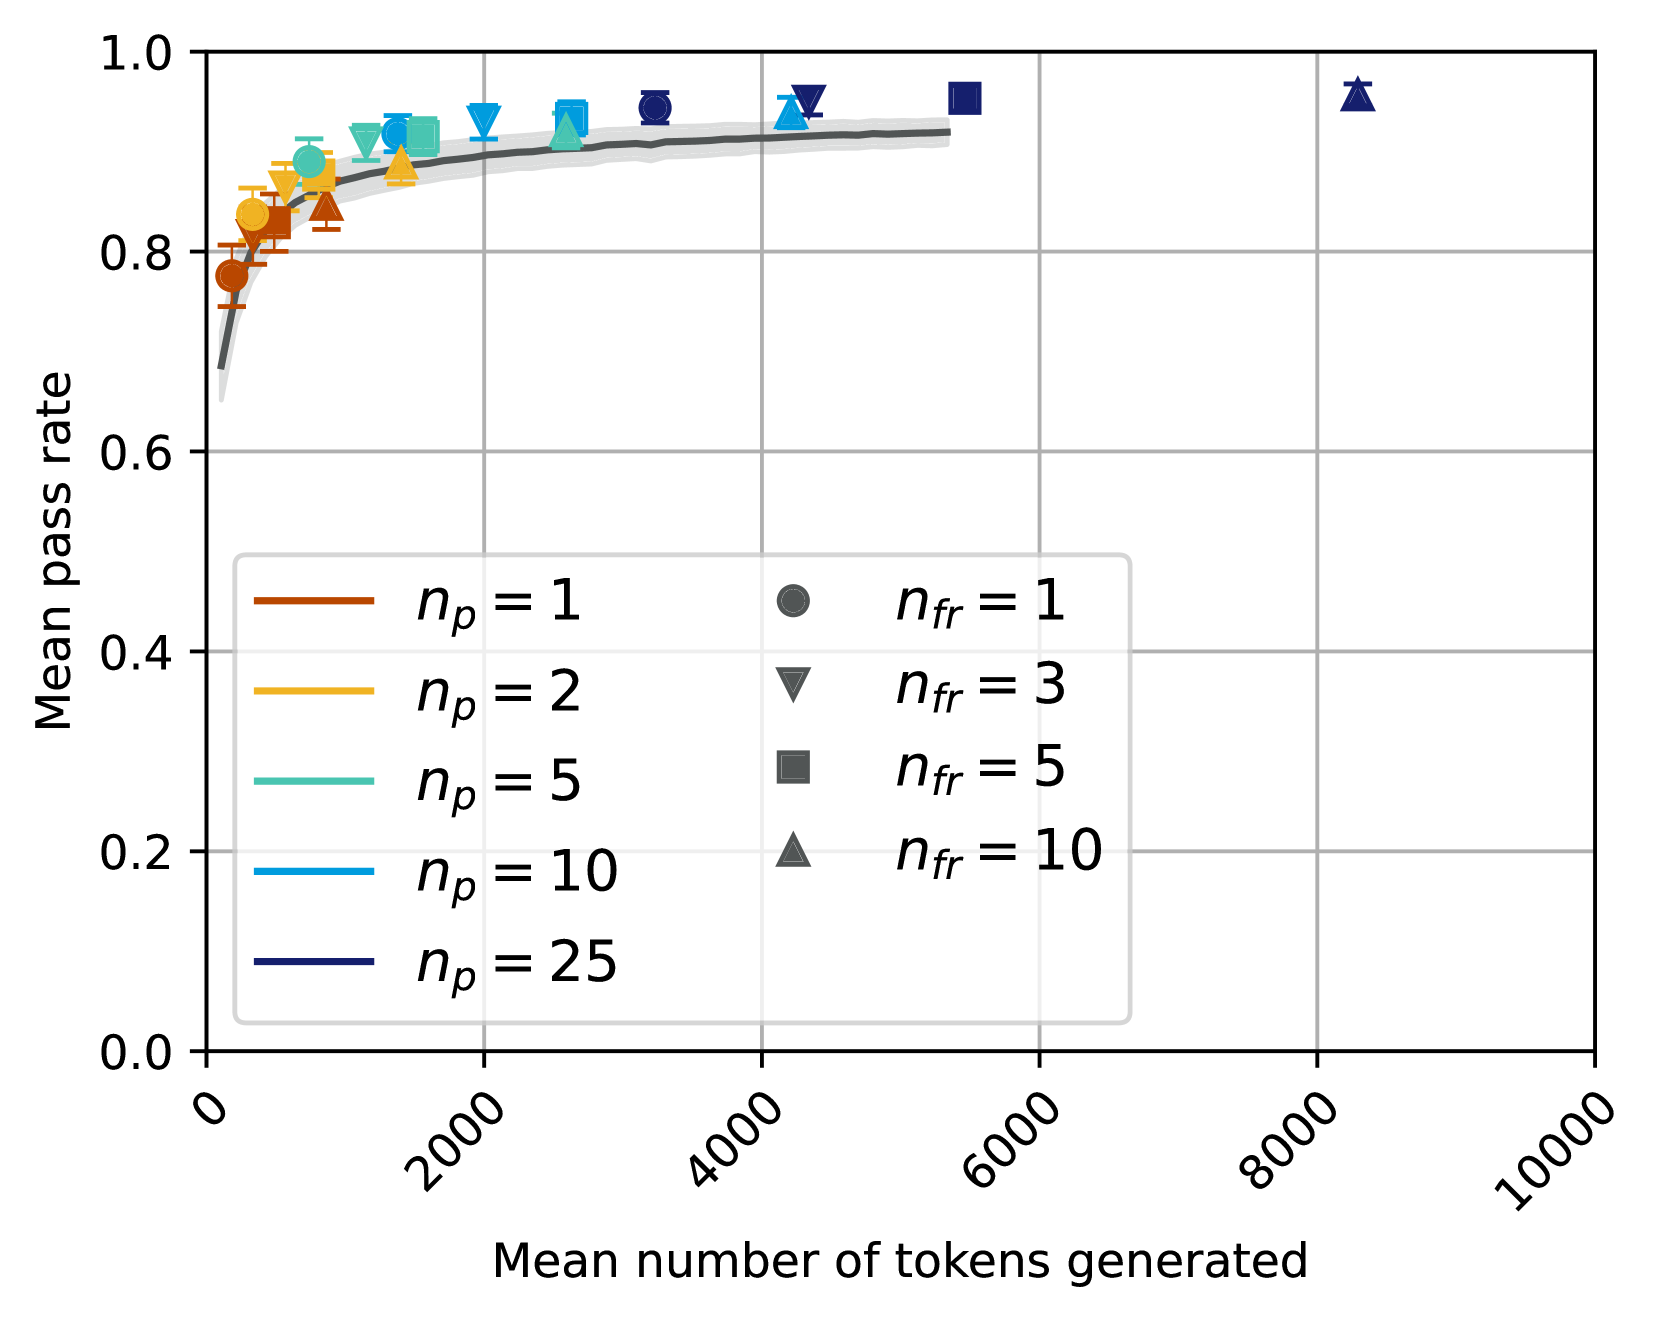
This image displays a scatter plot with error bars, overlaid with a general trend line and its confidence interval. It illustrates the relationship between the "Mean number of tokens generated" (X-axis) and the "Mean pass rate" (Y-axis) for various combinations of two parameters, `n_p` and `n_fr`. The `n_p` parameter is differentiated by the color of the data points, while the `n_fr` parameter is differentiated by the shape of the data points.
### Components/Axes
**X-axis:**
* **Title:** "Mean number of tokens generated"
* **Range:** From 0 to 10000
* **Major Tick Markers:** 0, 2000, 4000, 6000, 8000, 10000. The tick labels are rotated approximately 45 degrees counter-clockwise.
**Y-axis:**
* **Title:** "Mean pass rate"
* **Range:** From 0.0 to 1.0
* **Major Tick Markers:** 0.0, 0.2, 0.4, 0.6, 0.8, 1.0
**Legend:**
The legend is located in the bottom-left quadrant of the plot area, within a light gray box. It is divided into two columns:
* **Left Column (Line colors for `n_p` values):** These lines indicate the color mapping for the data points based on the `n_p` parameter.
* Brown line: `n_p = 1`
* Orange line: `n_p = 2`
* Teal/Light Blue line: `n_p = 5`
* Blue line: `n_p = 10`
* Dark Blue/Navy line: `n_p = 25`
* **Right Column (Marker shapes for `n_fr` values):** These gray markers indicate the shape mapping for the data points based on the `n_fr` parameter.
* Gray circle: `n_fr = 1`
* Gray inverted triangle: `n_fr = 3`
* Gray square: `n_fr = 5`
* Gray triangle: `n_fr = 10`
**Overall Trend Line:**
A thick gray line with a lighter gray shaded area (representing a confidence interval or standard deviation) is plotted across the data points. This line represents the general trend of "Mean pass rate" as "Mean number of tokens generated" increases, irrespective of specific `n_p` or `n_fr` values.
### Detailed Analysis
**Overall Trend (Gray Line):**
The gray trend line starts around a "Mean pass rate" of approximately 0.65 at very low "Mean number of tokens generated" (near 0). It rises steeply, indicating a rapid increase in pass rate with an initial increase in tokens. The slope then gradually decreases, and the line begins to flatten out, reaching a plateau around a "Mean pass rate" of 0.92 to 0.93 for "Mean number of tokens generated" between 3000 and 5500. The shaded gray area around the line suggests a variability or confidence interval of roughly +/- 0.02 to 0.03 in the pass rate.
**Individual Data Points (Colored by `n_p`, Shaped by `n_fr`):**
Each data point includes vertical error bars, which are generally small, indicating relatively low variability for each specific configuration. The points generally follow the upward-sloping and then plateauing trend of the overall gray line.
1. **`n_p = 1` (Brown colored points):**
* These points generally appear at the lower end of the "Mean number of tokens generated" spectrum for a given "Mean pass rate" compared to higher `n_p` values.
* **Circles (`n_fr = 1`):** E.g., (~500 tokens, ~0.78 pass rate), (~1000 tokens, ~0.83 pass rate), (~2000 tokens, ~0.88 pass rate), (~3000 tokens, ~0.91 pass rate).
* **Inverted Triangles (`n_fr = 3`):** E.g., (~700 tokens, ~0.82 pass rate), (~1500 tokens, ~0.87 pass rate), (~2500 tokens, ~0.90 pass rate).
* **Squares (`n_fr = 5`):** E.g., (~900 tokens, ~0.85 pass rate), (~1800 tokens, ~0.89 pass rate), (~3000 tokens, ~0.92 pass rate).
* **Triangles (`n_fr = 10`):** E.g., (~1200 tokens, ~0.87 pass rate), (~2200 tokens, ~0.90 pass rate), (~4000 tokens, ~0.93 pass rate).
* *Trend:* For `n_p = 1`, increasing `n_fr` generally shifts the points slightly to the right (more tokens) and slightly upwards (higher pass rate).
2. **`n_p = 2` (Orange colored points):**
* These points are generally shifted slightly to the right and/or slightly higher in pass rate compared to `n_p = 1` points.
* **Circles (`n_fr = 1`):** E.g., (~600 tokens, ~0.82 pass rate), (~1200 tokens, ~0.86 pass rate), (~2200 tokens, ~0.90 pass rate), (~3500 tokens, ~0.92 pass rate).
* **Inverted Triangles (`n_fr = 3`):** E.g., (~800 tokens, ~0.85 pass rate), (~1700 tokens, ~0.89 pass rate), (~2800 tokens, ~0.91 pass rate).
* **Squares (`n_fr = 5`):** E.g., (~1000 tokens, ~0.87 pass rate), (~2000 tokens, ~0.90 pass rate), (~3200 tokens, ~0.92 pass rate).
* **Triangles (`n_fr = 10`):** E.g., (~1400 tokens, ~0.89 pass rate), (~2500 tokens, ~0.91 pass rate), (~4200 tokens, ~0.93 pass rate).
3. **`n_p = 5` (Teal/Light Blue colored points):**
* These points continue the trend of shifting further right and/or higher in pass rate.
* **Circles (`n_fr = 1`):** E.g., (~700 tokens, ~0.85 pass rate), (~1400 tokens, ~0.89 pass rate), (~2500 tokens, ~0.91 pass rate), (~4000 tokens, ~0.93 pass rate).
* **Inverted Triangles (`n_fr = 3`):** E.g., (~900 tokens, ~0.87 pass rate), (~1900 tokens, ~0.90 pass rate), (~3000 tokens, ~0.92 pass rate).
* **Squares (`n_fr = 5`):** E.g., (~1100 tokens, ~0.89 pass rate), (~2200 tokens, ~0.91 pass rate), (~3500 tokens, ~0.93 pass rate).
* **Triangles (`n_fr = 10`):** E.g., (~1600 tokens, ~0.90 pass rate), (~2800 tokens, ~0.92 pass rate), (~4500 tokens, ~0.94 pass rate).
4. **`n_p = 10` (Blue colored points):**
* These points are generally further to the right and higher than `n_p = 5` points.
* **Circles (`n_fr = 1`):** E.g., (~800 tokens, ~0.87 pass rate), (~1600 tokens, ~0.90 pass rate), (~2800 tokens, ~0.92 pass rate), (~4500 tokens, ~0.94 pass rate).
* **Inverted Triangles (`n_fr = 3`):** E.g., (~1000 tokens, ~0.89 pass rate), (~2100 tokens, ~0.91 pass rate), (~3200 tokens, ~0.93 pass rate).
* **Squares (`n_fr = 5`):** E.g., (~1300 tokens, ~0.90 pass rate), (~2400 tokens, ~0.92 pass rate), (~3800 tokens, ~0.94 pass rate).
* **Triangles (`n_fr = 10`):** E.g., (~1800 tokens, ~0.91 pass rate), (~3000 tokens, ~0.93 pass rate), (~4800 tokens, ~0.95 pass rate).
5. **`n_p = 25` (Dark Blue/Navy colored points):**
* These points represent the highest `n_p` value and are generally located furthest to the right and highest on the plot.
* **Circles (`n_fr = 1`):** E.g., (~900 tokens, ~0.89 pass rate), (~1800 tokens, ~0.91 pass rate), (~3000 tokens, ~0.93 pass rate), (~5000 tokens, ~0.95 pass rate).
* **Inverted Triangles (`n_fr = 3`):** E.g., (~1100 tokens, ~0.90 pass rate), (~2300 tokens, ~0.92 pass rate), (~3500 tokens, ~0.94 pass rate).
* **Squares (`n_fr = 5`):** E.g., (~1500 tokens, ~0.91 pass rate), (~2600 tokens, ~0.93 pass rate), (~4000 tokens, ~0.95 pass rate), (~5500 tokens, ~0.96 pass rate).
* **Triangles (`n_fr = 10`):** E.g., (~2000 tokens, ~0.92 pass rate), (~3200 tokens, ~0.94 pass rate), (~5000 tokens, ~0.96 pass rate), and a distinct outlier at (~8200 tokens, ~0.97 pass rate).
### Key Observations
* **Diminishing Returns:** The "Mean pass rate" increases with "Mean number of tokens generated" but shows clear diminishing returns, plateauing at a pass rate of approximately 0.92-0.96.
* **Influence of `n_p`:** Higher values of `n_p` (represented by darker blue colors) generally correspond to data points that achieve slightly higher "Mean pass rates" but often require a greater "Mean number of tokens generated" to reach the plateau. The points for higher `n_p` values are shifted towards the right side of the plot.
* **Influence of `n_fr`:** For a given `n_p` value, increasing `n_fr` (from circle to inverted triangle to square to triangle) tends to shift the data points towards higher "Mean number of tokens generated" for similar or slightly improved "Mean pass rates." This suggests that higher `n_fr` values might involve generating more tokens.
* **Outlier Point:** A prominent outlier is the dark blue triangle (`n_p = 25`, `n_fr = 10`) located at approximately 8200 tokens and a 0.97 pass rate. This point achieves the highest observed pass rate but at a significantly higher token generation cost than other configurations that achieve pass rates in the 0.95-0.96 range (which typically require around 4000-5500 tokens).
* **Consistent Performance:** The relatively small error bars across all data points suggest that the mean pass rates are consistent and reliable for each tested configuration.
### Interpretation
The data suggests a clear trade-off between the "Mean number of tokens generated" and the "Mean pass rate." Initially, increasing token generation significantly improves the pass rate, but this effect quickly diminishes, indicating that there's an optimal range of token generation beyond which further increases yield minimal benefits.
The parameters `n_p` and `n_fr` appear to modulate this relationship. Higher `n_p` values seem to enable slightly higher peak pass rates, but they also push the "saturation point" further to the right on the X-axis, meaning more tokens are needed to achieve these higher rates. This could imply that `n_p` relates to the capacity or complexity of the generation process, where higher `n_p` allows for more thorough (and thus token-intensive) exploration, potentially leading to marginal gains in pass rate.
Similarly, `n_fr` seems to influence the token generation cost. As `n_fr` increases, more tokens are generally required to achieve comparable or slightly better pass rates for a given `n_p`. This might indicate that `n_fr` controls the breadth or diversity of generated tokens, where higher values lead to more extensive (and thus token-heavy) outputs.
The outlier point (`n_p = 25`, `n_fr = 1
DECODING INTELLIGENCE...