\n
## Chart: Atom Number Distribution
### Overview
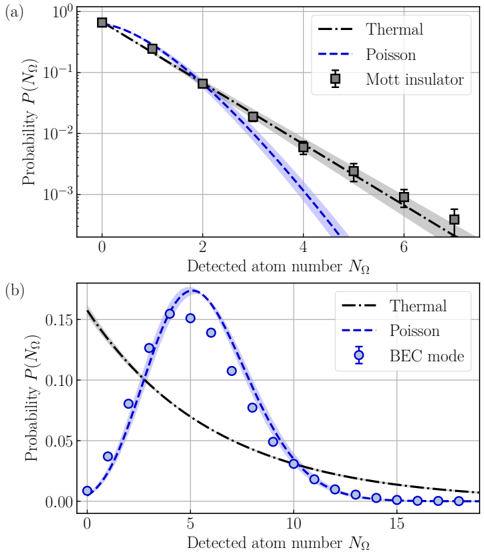
The image presents two charts (labeled (a) and (b)) displaying the probability distribution of detected atom numbers. Both charts share the same x-axis label ("Detected atom number NΩ") and y-axis label ("Probability P(NΩ)"), but differ in their y-axis scale (logarithmic in (a) and linear in (b)). Each chart compares experimental data (represented by markers with error bars) to theoretical distributions: Thermal and Poisson. Chart (a) focuses on the Mott insulator state, while chart (b) focuses on the BEC mode.
### Components/Axes
* **X-axis:** "Detected atom number NΩ", ranging from approximately 0 to 6 in (a) and 0 to 12 in (b).
* **Y-axis (a):** "Probability P(NΩ)", logarithmic scale, ranging from approximately 10⁻³ to 10⁰.
* **Y-axis (b):** "Probability P(NΩ)", linear scale, ranging from approximately 0 to 0.16.
* **Legend:**
* **Chart (a):**
* Black dashed line: "Thermal"
* Blue dashed line: "Poisson"
* Gray square markers with error bars: "Mott insulator"
* **Chart (b):**
* Black dashed line: "Thermal"
* Blue dashed line: "Poisson"
* Blue circle markers with error bars: "BEC mode"
* **Grid:** Both charts have a grid for easier value reading.
### Detailed Analysis or Content Details
**Chart (a): Mott Insulator**
* **Mott Insulator (Gray Squares):** The data points show a decreasing probability as the detected atom number increases.
* NΩ = 0: P(NΩ) ≈ 0.95 ± 0.05
* NΩ = 1: P(NΩ) ≈ 0.30 ± 0.05
* NΩ = 2: P(NΩ) ≈ 0.10 ± 0.02
* NΩ = 3: P(NΩ) ≈ 0.03 ± 0.01
* NΩ = 4: P(NΩ) ≈ 0.01 ± 0.005
* NΩ = 5: P(NΩ) ≈ 0.003 ± 0.002
* NΩ = 6: P(NΩ) ≈ 0.001 ± 0.001
* **Thermal (Black Dashed):** Starts at approximately 1 and decreases slowly with increasing NΩ.
* **Poisson (Blue Dashed):** Starts at approximately 1 and decreases more rapidly than the Thermal distribution.
**Chart (b): BEC Mode**
* **BEC Mode (Blue Circles):** The data points show an initial increase in probability, reaching a maximum around NΩ = 4, and then decreasing.
* NΩ = 0: P(NΩ) ≈ 0.02 ± 0.01
* NΩ = 1: P(NΩ) ≈ 0.06 ± 0.01
* NΩ = 2: P(NΩ) ≈ 0.10 ± 0.01
* NΩ = 3: P(NΩ) ≈ 0.14 ± 0.01
* NΩ = 4: P(NΩ) ≈ 0.15 ± 0.01
* NΩ = 5: P(NΩ) ≈ 0.11 ± 0.01
* NΩ = 6: P(NΩ) ≈ 0.07 ± 0.01
* NΩ = 7: P(NΩ) ≈ 0.04 ± 0.01
* NΩ = 8: P(NΩ) ≈ 0.02 ± 0.01
* NΩ = 9: P(NΩ) ≈ 0.015 ± 0.005
* NΩ = 10: P(NΩ) ≈ 0.01 ± 0.005
* NΩ = 11: P(NΩ) ≈ 0.005 ± 0.003
* NΩ = 12: P(NΩ) ≈ 0.003 ± 0.002
* **Thermal (Black Dashed):** Decreases monotonically with increasing NΩ.
* **Poisson (Blue Dashed):** Increases initially, reaches a maximum around NΩ = 2, and then decreases.
### Key Observations
* In Chart (a), the Mott insulator data deviates significantly from both the Thermal and Poisson distributions, especially at higher atom numbers. The Mott insulator distribution decays much faster than the Poisson distribution.
* In Chart (b), the BEC mode data shows a clear peak, indicating a preferred atom number. The BEC mode distribution is significantly different from both the Thermal and Poisson distributions.
* The logarithmic scale in Chart (a) emphasizes the differences in the tail of the distribution, while the linear scale in Chart (b) highlights the peak.
### Interpretation
These charts demonstrate the distinct statistical properties of different quantum states of atoms. Chart (a) shows that the Mott insulator state exhibits a strong suppression of atom number fluctuations, deviating from the predictions of both thermal and Poisson statistics. This is consistent with the theoretical expectation that Mott insulators are characterized by a fixed number of atoms per site. Chart (b) shows that the BEC mode exhibits a peak in the probability distribution, indicating a tendency for atoms to condense into the same quantum state. The shape of the BEC mode distribution is also different from both thermal and Poisson statistics, reflecting the unique quantum mechanical properties of Bose-Einstein condensates. The comparison to the Poisson distribution is particularly relevant, as the Poisson distribution describes the statistics of independent events, while the Mott insulator and BEC mode represent correlated quantum states. The error bars on the experimental data indicate the uncertainty in the measurements, and the agreement between the experimental data and the theoretical predictions provides strong evidence for the validity of the theoretical models. The use of two different y-axis scales allows for a more comprehensive comparison of the distributions, highlighting both the overall shape and the details of the tails.