## Histogram: Token Frequency for Questions and Answers
### Overview
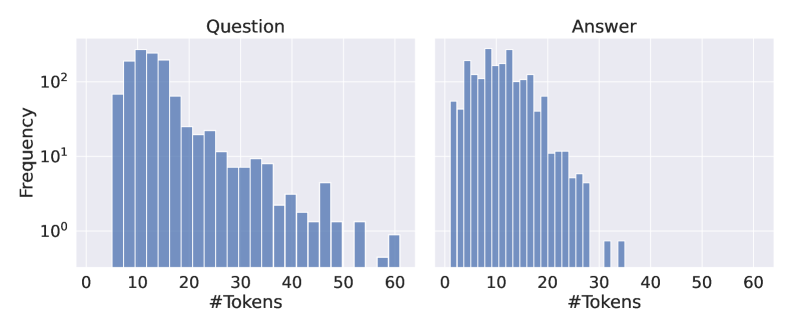
The image presents two histograms side-by-side, comparing the frequency of token counts for "Question" and "Answer" texts. The y-axis (Frequency) is on a logarithmic scale, and the x-axis represents the number of tokens. Both histograms display the distribution of token counts, showing how often different token lengths appear in the respective text categories.
### Components/Axes
* **Titles:** "Question" (left histogram), "Answer" (right histogram)
* **X-axis:** "#Tokens" (shared by both histograms), ranging from 0 to 60 in increments of 10.
* **Y-axis:** "Frequency" (shared by both histograms), on a logarithmic scale from 10^0 (1) to 10^2 (100).
* **Bars:** Blue bars represent the frequency of each token count.
### Detailed Analysis
**Question Histogram:**
* The distribution is right-skewed.
* The highest frequency occurs between 10 and 20 tokens.
* Frequency decreases as the number of tokens increases beyond 20.
* Approximate Frequencies:
* 5 tokens: ~20
* 10 tokens: ~120
* 15 tokens: ~150
* 20 tokens: ~80
* 30 tokens: ~10
* 40 tokens: ~5
* 50 tokens: ~5
* 60 tokens: ~1
**Answer Histogram:**
* The distribution is also right-skewed, but less pronounced than the "Question" histogram.
* The highest frequency occurs between 5 and 20 tokens.
* Frequency decreases as the number of tokens increases beyond 20.
* Approximate Frequencies:
* 5 tokens: ~80
* 10 tokens: ~140
* 15 tokens: ~120
* 20 tokens: ~60
* 30 tokens: ~2
* 40 tokens: ~0
* 50 tokens: ~0
* 60 tokens: ~2
### Key Observations
* Both "Question" and "Answer" texts tend to have a relatively low number of tokens, with the majority falling between 5 and 20.
* The "Question" histogram shows a slightly wider distribution, with some questions having a higher number of tokens compared to answers.
* The logarithmic scale on the y-axis emphasizes the differences in frequency, especially for less common token counts.
### Interpretation
The histograms suggest that both questions and answers are generally concise, with a preference for shorter token lengths. The right-skewed distributions indicate that longer questions and answers are less frequent. The "Question" histogram's wider distribution might reflect the need for more detailed or complex questions in certain contexts, while answers tend to be more focused and shorter. The logarithmic scale highlights the relative rarity of longer texts in both categories.