\n
## Chart: Token Frequency Distribution for Questions and Answers
### Overview
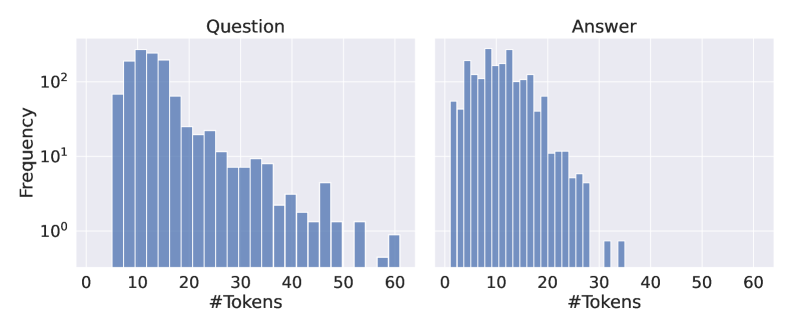
The image presents two histograms displayed side-by-side. Both histograms depict the frequency distribution of the number of tokens in a dataset. The left histogram represents the distribution for "Question" data, and the right histogram represents the distribution for "Answer" data. Both histograms use a logarithmic scale on the y-axis (Frequency).
### Components/Axes
* **X-axis Label (Both Charts):** "#Tokens" - Represents the number of tokens. The scale ranges from 0 to 60.
* **Y-axis Label (Both Charts):** "Frequency" - Represents the number of occurrences of a given number of tokens. The scale is logarithmic, ranging from 10⁰ (1) to 10² (100).
* **Title (Left Chart):** "Question"
* **Title (Right Chart):** "Answer"
* **Data Series (Both Charts):** A single series of bar heights representing the frequency of each token count.
### Detailed Analysis
**Question Histogram:**
The distribution is approximately normal, but skewed to the right. The peak frequency occurs around 10-12 tokens. The frequency decreases as the number of tokens increases, with a long tail extending to 60 tokens.
* Approximately 100 occurrences between 8 and 14 tokens.
* Approximately 50 occurrences between 15 and 20 tokens.
* Approximately 20 occurrences between 20 and 25 tokens.
* Approximately 10 occurrences between 25 and 30 tokens.
* Approximately 5 occurrences between 30 and 40 tokens.
* Approximately 2 occurrences between 40 and 50 tokens.
* Approximately 1 occurrence between 50 and 60 tokens.
**Answer Histogram:**
The distribution is also approximately normal, but slightly more concentrated around the lower token counts compared to the Question histogram. The peak frequency occurs around 10-14 tokens. The frequency decreases as the number of tokens increases, with a tail extending to 60 tokens.
* Approximately 120 occurrences between 8 and 14 tokens.
* Approximately 60 occurrences between 15 and 20 tokens.
* Approximately 30 occurrences between 20 and 25 tokens.
* Approximately 15 occurrences between 25 and 30 tokens.
* Approximately 7 occurrences between 30 and 35 tokens.
* Approximately 3 occurrences between 35 and 40 tokens.
* Approximately 1 occurrence between 40 and 50 tokens.
* Approximately 1 occurrence between 50 and 60 tokens.
### Key Observations
* The "Answer" histogram has a higher peak frequency than the "Question" histogram, suggesting that answers tend to be shorter than questions.
* Both distributions are right-skewed, indicating that there are some questions and answers with a significantly higher number of tokens than the average.
* The logarithmic scale on the y-axis emphasizes the differences in frequency at lower token counts.
### Interpretation
The data suggests that the length of questions and answers in the dataset varies, but answers are generally shorter than questions. The distributions provide insights into the typical length of text used in this question-answering context. The right skewness indicates that while most questions and answers are relatively short, there are some outliers with a large number of tokens, potentially representing complex or detailed queries and responses. The difference in peak frequency between the two histograms suggests a systematic difference in the length of questions and answers, which could be due to the nature of the task or the way the data was collected. The use of a logarithmic scale is appropriate for visualizing frequency distributions where there is a wide range of values, as it allows for better visualization of the lower frequency events.