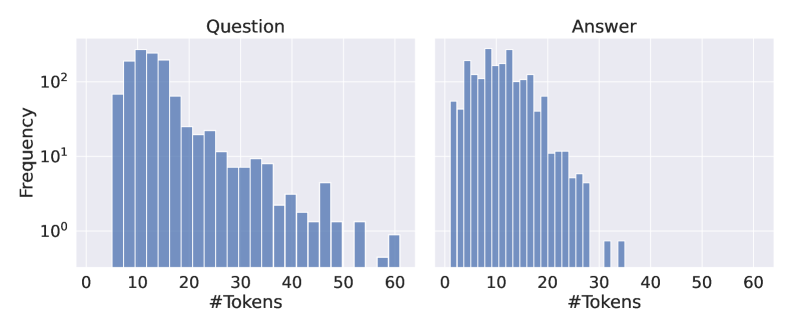
## Histograms: Question and Answer Token Length Distributions
### Overview
The image displays two side-by-side histograms comparing the frequency distribution of token counts for "Question" and "Answer" text segments. Both charts share identical axes and scales, facilitating direct comparison. The data is presented on a semi-logarithmic plot (log scale on the y-axis).
### Components/Axes
* **Titles:** "Question" (left chart), "Answer" (right chart).
* **X-Axis (Both Charts):** Labeled "#Tokens". Linear scale ranging from 0 to 60, with major tick marks at intervals of 10 (0, 10, 20, 30, 40, 50, 60).
* **Y-Axis (Left Chart Only):** Labeled "Frequency". Logarithmic scale (base 10) with major tick marks at 10⁰ (1), 10¹ (10), and 10² (100).
* **Data Series:** Both histograms use identical blue bars. No legend is present, as each chart contains a single data series.
* **Spatial Layout:** The two histograms are positioned horizontally adjacent, sharing a common y-axis scale implied by the left chart's labels.
### Detailed Analysis
**1. Question Histogram (Left Chart):**
* **Trend:** The distribution is right-skewed with a long tail. Frequency peaks sharply at low token counts and decays gradually as token count increases.
* **Data Points (Approximate):**
* Peak Frequency: Occurs between 10-15 tokens, with a frequency value between 10² (100) and 2*10² (200).
* High Frequency Range (10¹ to 10²): Spans from approximately 5 tokens to 25 tokens.
* Mid Frequency Range (10⁰ to 10¹): Spans from approximately 25 tokens to 45 tokens.
* Low Frequency Tail (<10⁰): Extends from ~45 tokens to 60 tokens, with frequencies dropping to near or below 1 (10⁰). There is a small, isolated bar at 60 tokens.
**2. Answer Histogram (Right Chart):**
* **Trend:** The distribution is also right-skewed but is more concentrated and drops off more abruptly than the Question distribution. It has a much shorter tail.
* **Data Points (Approximate):**
* Peak Frequency: Occurs between 10-15 tokens, similar to the Question chart, with a frequency value between 10² (100) and 2*10² (200).
* High Frequency Range (10¹ to 10²): Spans from approximately 5 tokens to 20 tokens.
* Mid Frequency Range (10⁰ to 10¹): Spans from approximately 20 tokens to 30 tokens.
* Low Frequency Tail (<10⁰): Very sparse. There are isolated, very low-frequency bars (near 10⁰) at approximately 32 and 34 tokens. No data is visible beyond ~35 tokens.
### Key Observations
1. **Similar Peaks:** Both questions and answers have their highest frequency in the 10-15 token range.
2. **Divergent Tails:** The most significant difference is in the length of the tail. Questions exhibit a "heavy tail," with a non-trivial number of instances extending to 60 tokens. Answers have a "short tail," with almost no instances beyond 35 tokens.
3. **Concentration:** The answer distribution is more concentrated. The bulk of answers (the majority with frequency >10) fall within a narrower band (~5-20 tokens) compared to questions (~5-25 tokens).
4. **Log Scale Implication:** The use of a logarithmic y-axis emphasizes that while the peak frequencies are similar, the differences in the tails represent orders-of-magnitude differences in actual count.
### Interpretation
This data suggests a fundamental asymmetry in the structure of the dataset being analyzed. Questions are more variable in length, capable of being very concise or quite verbose. Answers, however, are strongly constrained to a shorter, more consistent length.
This pattern could indicate several underlying principles:
* **System Design:** The system generating or curating these answers may have a built-in bias or constraint favoring concise responses.
* **Task Nature:** The question-answering task itself may naturally elicit shorter, more focused responses than the inquiries that prompt them.
* **Data Curation:** The dataset might have been filtered or processed to standardize answer length, while leaving question length unmodified.
The absence of long answers (beyond ~35 tokens) is a notable anomaly. It implies a hard cutoff or a strong selection pressure against lengthy responses in this specific context. The investigation would benefit from examining examples of the longest questions and the (non-existent) longest answers to understand the practical limits of the system.