## Flowchart: Hypothesis Evaluation Based on Observations
### Overview
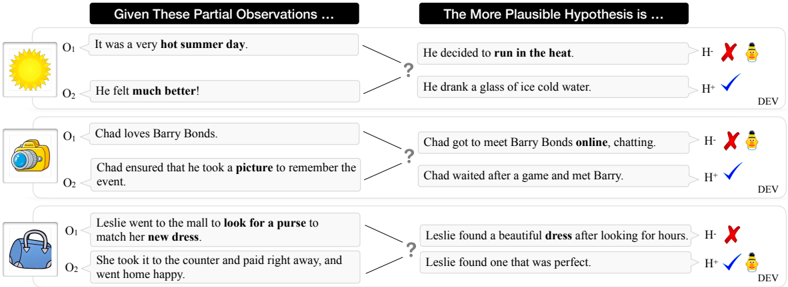
The image presents a flowchart with three scenarios, each containing partial observations (O1, O2) and two competing hypotheses (H⁻, H⁺). The hypotheses are evaluated for plausibility, with checkmarks (✓) and X marks indicating the more likely outcome. Visual icons (sun, camera, purse) accompany the observations.
### Components/Axes
- **Main Structure**:
- Three independent scenarios (top to bottom).
- Each scenario includes:
- **Observations**: Labeled O1 and O2 (textual descriptions).
- **Hypotheses**: Labeled H⁻ (less plausible) and H⁺ (more plausible).
- **Evaluation Symbols**: Red X (❌) for H⁻, blue checkmark (✓) for H⁺.
- **Visual Elements**:
- Icons: Sun (hot weather), camera (photography), purse (shopping).
- Arrows connecting observations to hypotheses.
- Question marks (?) linking observations to hypotheses.
### Detailed Analysis
#### Scenario 1: Hot Summer Day
- **Observations**:
- O1: "It was a very hot summer day." (Icon: ☀️)
- O2: "He felt much better!"
- **Hypotheses**:
- H⁻: "He decided to run in the heat." (❌)
- H⁺: "He drank a glass of ice cold water." (✓)
#### Scenario 2: Barry Bonds Fan
- **Observations**:
- O1: "Chad loves Barry Bonds." (Icon: 📸)
- O2: "Chad ensured that he took a picture to remember the event."
- **Hypotheses**:
- H⁻: "Chad got to meet Barry Bonds online, chatting." (❌)
- H⁺: "Chad waited after a game and met Barry." (✓)
#### Scenario 3: Purses and Dresses
- **Observations**:
- O1: "Leslie went to the mall to look for a purse to match her new dress." (Icon: 👜)
- O2: "She took it to the counter and paid right away, and went home happy."
- **Hypotheses**:
- H⁻: "Leslie found a beautiful dress after looking for hours." (❌)
- H⁺: "Leslie found one that was perfect." (✓)
### Key Observations
1. **Consistency in Evaluation**: H⁺ (more plausible) is always marked with a checkmark (✓), while H⁻ is marked with an X (❌).
2. **Logical Alignment**: H⁺ hypotheses directly resolve the observations without contradiction (e.g., drinking water cools the body on a hot day).
3. **Visual Cues**: Icons reinforce the context of each observation (e.g., ☀️ for heat, 📸 for photography).
### Interpretation
The flowchart demonstrates a framework for evaluating hypotheses based on observed facts. The checkmarks suggest that the most plausible hypothesis is the one that:
- **Directly addresses the observations** (e.g., ice water alleviates heat discomfort).
- **Avoids unnecessary assumptions** (e.g., meeting Barry Bonds online is less likely than meeting him in person after a game).
- **Aligns with common-sense reasoning** (e.g., finding a "perfect" purse quickly implies satisfaction, unlike prolonged searching).
This structure emphasizes the importance of grounding hypotheses in observable evidence and logical consistency, a principle applicable to scientific inquiry, problem-solving, and decision-making.