## Line Chart: Accuracy vs. Sample Size
### Overview
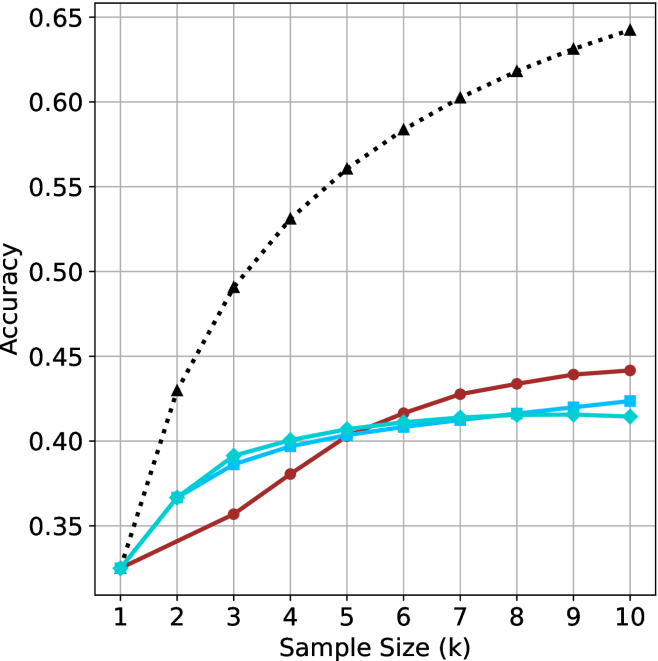
The image is a line chart that plots the accuracy of different models against the sample size, measured in thousands (k). There are four data series represented by different colored lines with distinct markers. The chart shows how accuracy changes as the sample size increases.
### Components/Axes
* **X-axis:** Sample Size (k), ranging from 1 to 10 in increments of 1.
* **Y-axis:** Accuracy, ranging from 0.35 to 0.65 in increments of 0.05.
* **Gridlines:** Present for both x and y axes.
* **Data Series:** Four distinct data series are plotted. The legend is missing, so the series are described by color and marker.
* Black dotted line with triangle markers.
* Red line with circle markers.
* Blue line with square markers.
* Cyan line with diamond markers.
### Detailed Analysis
**1. Black Dotted Line with Triangle Markers:**
* **Trend:** This line shows a steep upward trend, indicating a significant increase in accuracy with increasing sample size.
* **Data Points:**
* Sample Size 1k: Accuracy ~0.33
* Sample Size 2k: Accuracy ~0.43
* Sample Size 3k: Accuracy ~0.49
* Sample Size 4k: Accuracy ~0.53
* Sample Size 5k: Accuracy ~0.56
* Sample Size 6k: Accuracy ~0.58
* Sample Size 7k: Accuracy ~0.60
* Sample Size 8k: Accuracy ~0.62
* Sample Size 9k: Accuracy ~0.63
* Sample Size 10k: Accuracy ~0.64
**2. Red Line with Circle Markers:**
* **Trend:** This line shows a gradual upward trend, with the accuracy increasing at a slower rate compared to the black dotted line.
* **Data Points:**
* Sample Size 1k: Accuracy ~0.33
* Sample Size 2k: Accuracy ~0.35
* Sample Size 3k: Accuracy ~0.37
* Sample Size 4k: Accuracy ~0.39
* Sample Size 5k: Accuracy ~0.40
* Sample Size 6k: Accuracy ~0.41
* Sample Size 7k: Accuracy ~0.43
* Sample Size 8k: Accuracy ~0.43
* Sample Size 9k: Accuracy ~0.44
* Sample Size 10k: Accuracy ~0.44
**3. Blue Line with Square Markers:**
* **Trend:** This line shows a slight upward trend, with the accuracy increasing very slowly.
* **Data Points:**
* Sample Size 1k: Accuracy ~0.33
* Sample Size 2k: Accuracy ~0.37
* Sample Size 3k: Accuracy ~0.39
* Sample Size 4k: Accuracy ~0.40
* Sample Size 5k: Accuracy ~0.41
* Sample Size 6k: Accuracy ~0.41
* Sample Size 7k: Accuracy ~0.42
* Sample Size 8k: Accuracy ~0.42
* Sample Size 9k: Accuracy ~0.43
* Sample Size 10k: Accuracy ~0.43
**4. Cyan Line with Diamond Markers:**
* **Trend:** This line shows a slight upward trend, similar to the blue line.
* **Data Points:**
* Sample Size 1k: Accuracy ~0.33
* Sample Size 2k: Accuracy ~0.37
* Sample Size 3k: Accuracy ~0.39
* Sample Size 4k: Accuracy ~0.40
* Sample Size 5k: Accuracy ~0.40
* Sample Size 6k: Accuracy ~0.41
* Sample Size 7k: Accuracy ~0.41
* Sample Size 8k: Accuracy ~0.42
* Sample Size 9k: Accuracy ~0.42
* Sample Size 10k: Accuracy ~0.42
### Key Observations
* The black dotted line (triangle markers) demonstrates the most significant improvement in accuracy as the sample size increases.
* The red, blue, and cyan lines show much smaller improvements in accuracy with increasing sample size.
* The blue and cyan lines are very close to each other, indicating similar performance characteristics.
* All lines start at approximately the same accuracy (~0.33) with a sample size of 1k.
### Interpretation
The chart suggests that the model represented by the black dotted line benefits the most from larger sample sizes, achieving significantly higher accuracy compared to the other models. The other models (red, blue, and cyan) show diminishing returns with increasing sample size, indicating that their performance is less sensitive to the amount of training data. This could be due to differences in model complexity, architecture, or training methodology. The black dotted line model is likely more complex or better suited to leverage the additional information provided by larger datasets.