## Line Graph: Rouge-L vs Tree Width
### Overview
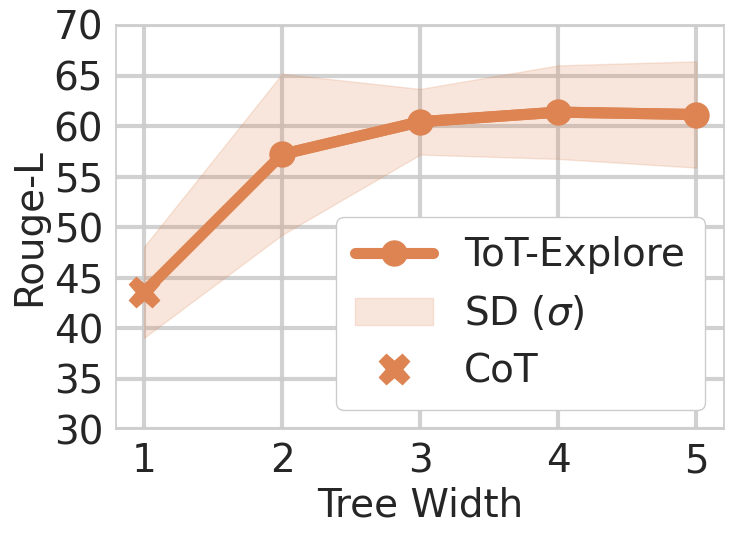
The image is a line graph comparing the performance metric "Rouge-L" across different "Tree Width" values (1–5). It includes three data series: a primary line labeled "ToT-Explore," a shaded region labeled "SD (σ)," and discrete points labeled "CoT." The graph emphasizes trends in Rouge-L scores as Tree Width increases.
### Components/Axes
- **X-axis (Tree Width)**: Discrete values from 1 to 5, labeled "Tree Width."
- **Y-axis (Rouge-L)**: Continuous scale from 30 to 70, labeled "Rouge-L."
- **Legend**: Located in the bottom-right corner, with three entries:
- **ToT-Explore**: Orange line with circular markers.
- **SD (σ)**: Light orange shaded area.
- **CoT**: Orange crosses (×).
- **Gridlines**: Gray horizontal and vertical lines for reference.
### Detailed Analysis
1. **ToT-Explore (Orange Line)**:
- Starts at **~45** when Tree Width = 1.
- Increases steadily to **~60** by Tree Width = 5.
- Slope: Gradual upward trend with minor fluctuations (e.g., slight dip at Tree Width = 4).
- Key data points:
- Tree Width 1: ~45
- Tree Width 2: ~58
- Tree Width 3: ~60
- Tree Width 4: ~61
- Tree Width 5: ~60
2. **SD (σ) (Light Orange Shaded Area)**:
- Represents variability around the ToT-Explore line.
- Width decreases as Tree Width increases:
- Widest at Tree Width = 1 (~±5 units).
- Narrowest at Tree Width = 5 (~±3 units).
3. **CoT (Orange Crosses)**:
- Two points:
- Tree Width 1: ~45 (matches ToT-Explore's starting value).
- Tree Width 5: ~60 (matches ToT-Explore's ending value).
- No intermediate values plotted.
### Key Observations
- **ToT-Explore** shows a consistent upward trend, with a plateau at Tree Width = 5.
- **SD (σ)** indicates decreasing variability in performance as Tree Width increases.
- **CoT** aligns with ToT-Explore's endpoints but lacks intermediate data, suggesting limited comparison points.
### Interpretation
The graph demonstrates that **ToT-Explore** improves in Rouge-L scores as Tree Width increases, with diminishing returns after Tree Width = 3. The narrowing SD region implies greater consistency in performance at higher Tree Widths. The CoT points at Tree Widths 1 and 5 suggest that CoT's performance matches ToT-Explore's at these extremes but does not provide insight into intermediate values. This could indicate that CoT is either equivalent to ToT-Explore at these points or that intermediate Tree Widths are not tested for CoT. The overall trend supports the hypothesis that wider trees enhance performance, but the benefits stabilize beyond a certain width.