## Scatter/Stem Plot: GPU Throughput vs. Hidden Size
### Overview
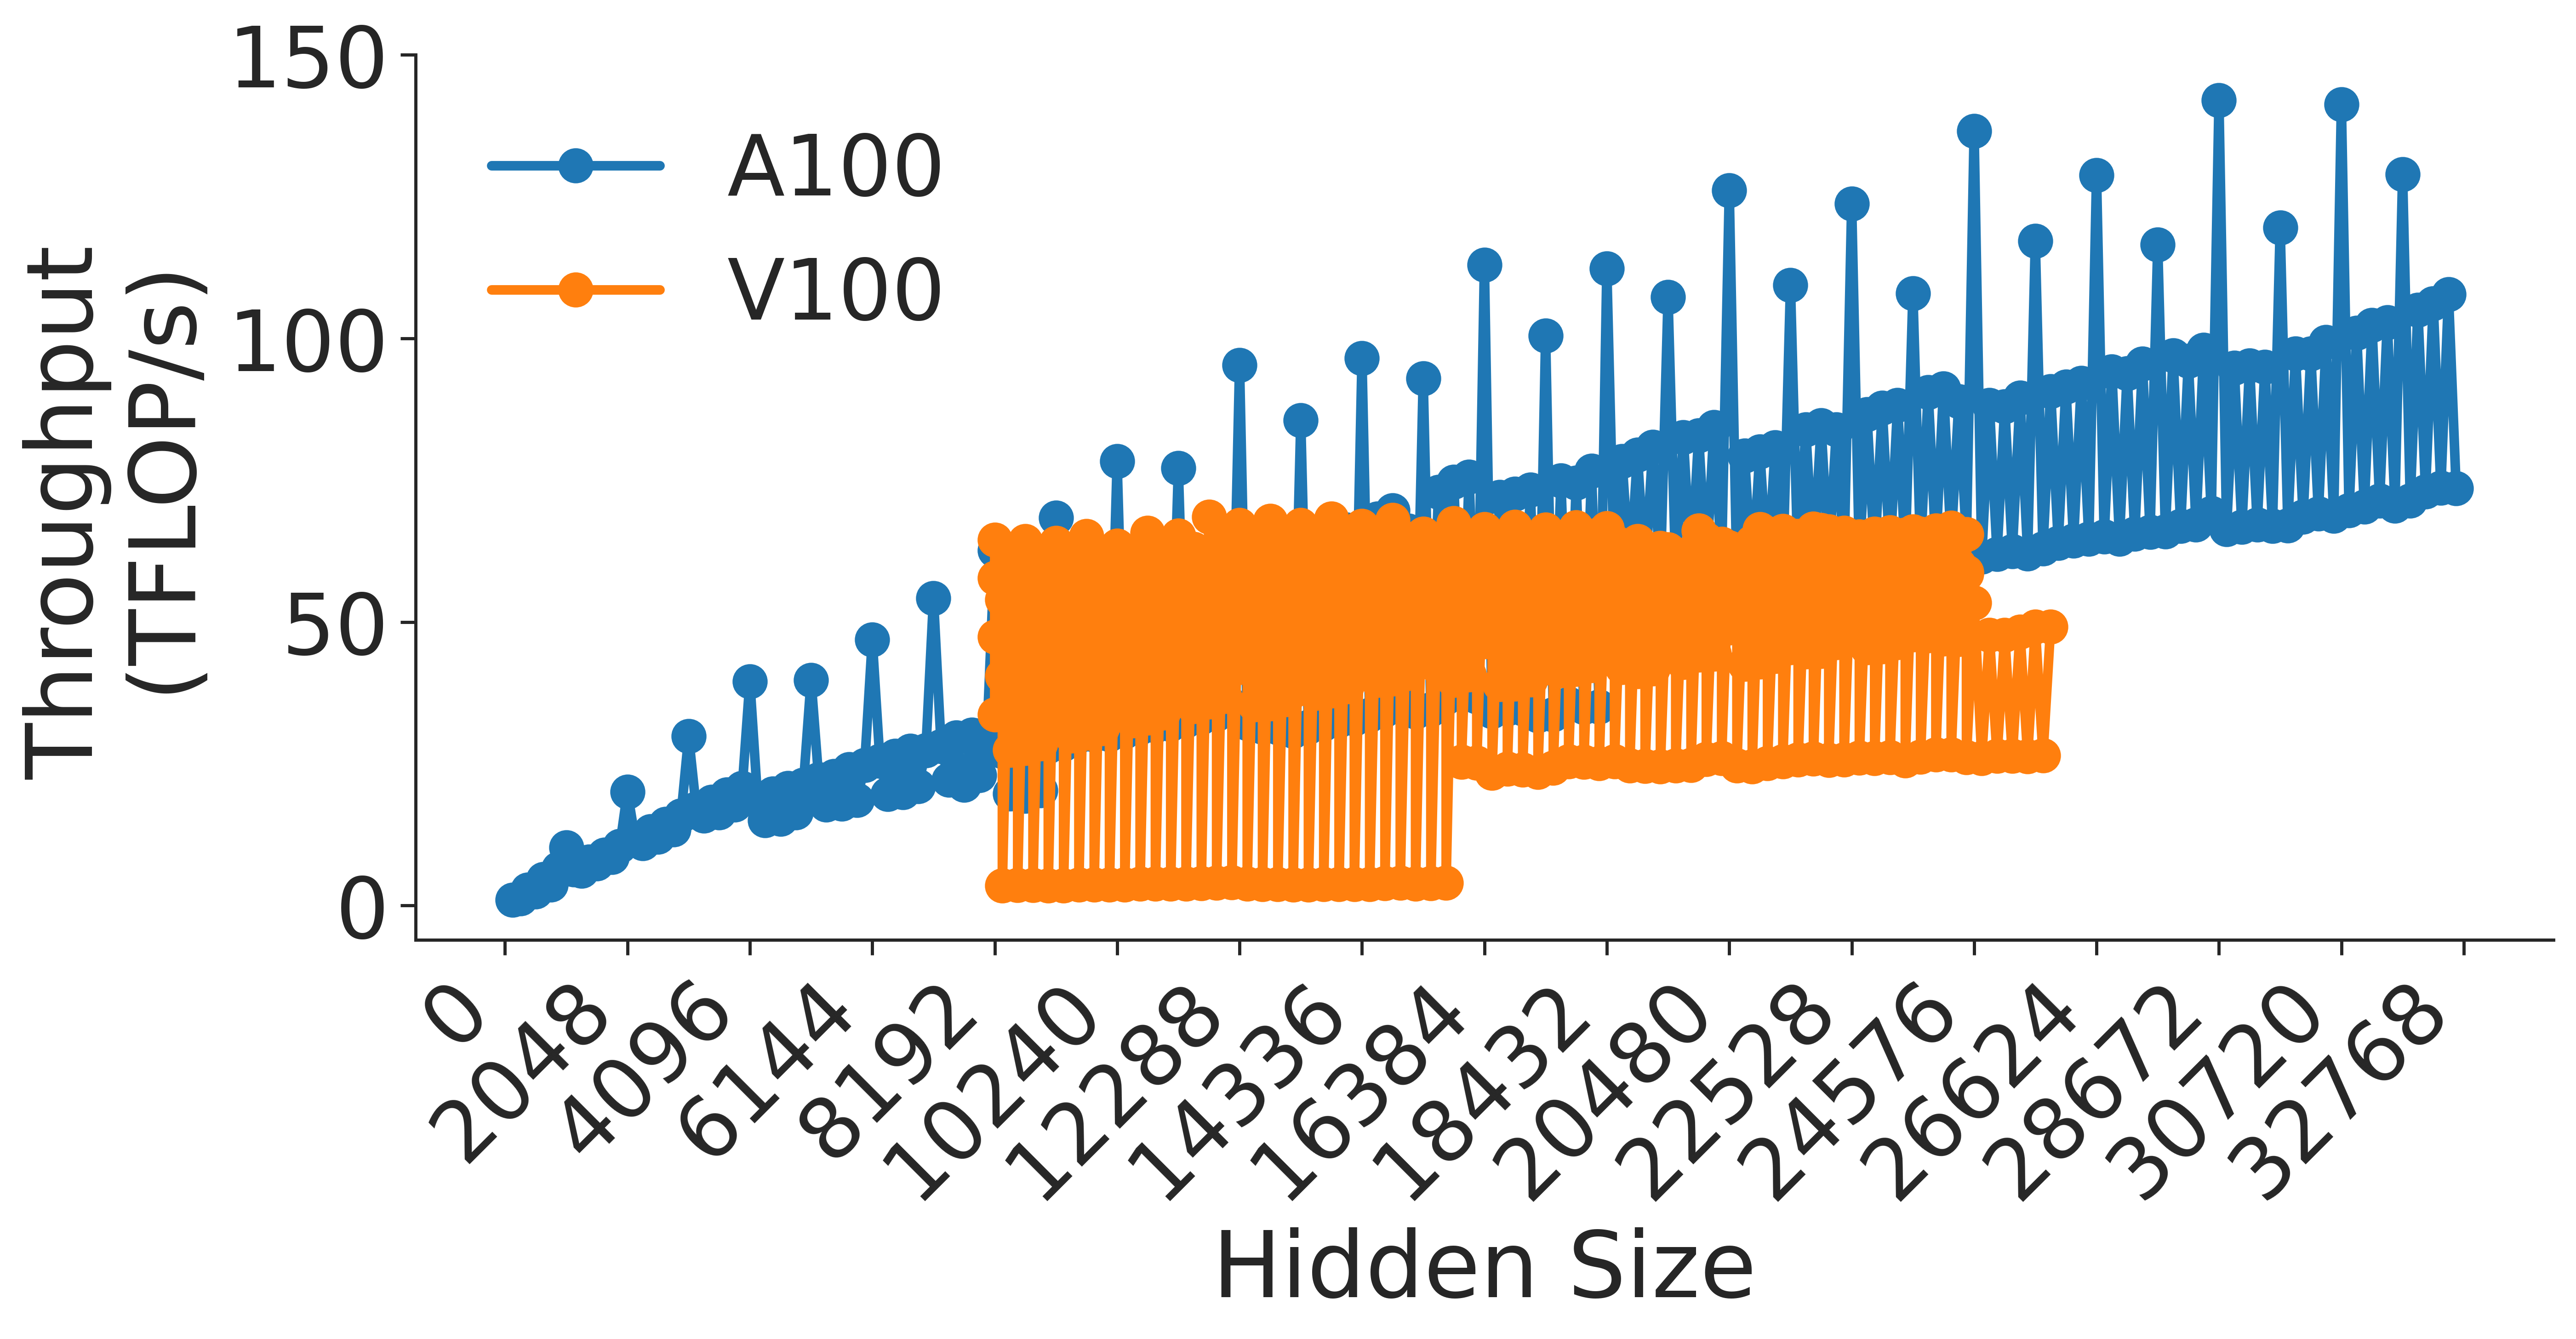
This image is a performance benchmark chart comparing the throughput (measured in TFLOP/s) of two NVIDIA GPU architectures, the **A100** and the **V100**, across varying "Hidden Size" parameters. The chart uses a stem-plot (or "lollipop") style visualization to represent data points, highlighting significant variance in performance at specific hidden size increments.
### Components/Axes
* **Y-Axis:** Labeled "Throughput (TFLOP/s)". The scale ranges from 0 to 150, with major increments every 50 units.
* **X-Axis:** Labeled "Hidden Size". The scale ranges from 0 to 32,768. The labels are rotated 45 degrees for readability.
* **Legend:** Located in the top-left corner.
* **Blue line/dot:** Represents the **A100** GPU.
* **Orange line/dot:** Represents the **V100** GPU.
### Detailed Analysis
The chart displays two distinct data series with different behaviors:
**1. A100 (Blue Series)**
* **Trend:** The A100 series shows a clear, positive upward trend as the Hidden Size increases.
* **Pattern:** It exhibits a "comb" or "sawtooth" pattern. At every hidden size increment, there is a vertical line connecting a lower baseline value to a significantly higher peak value.
* **Values:**
* At lower hidden sizes (near 2,048), the peaks are around 20–30 TFLOP/s.
* As hidden size increases toward 32,768, the peaks climb steadily, reaching approximately 140–145 TFLOP/s.
* The "troughs" (the base of the vertical lines) also rise gradually, moving from near 0 TFLOP/s to approximately 70–80 TFLOP/s at the highest hidden sizes.
**2. V100 (Orange Series)**
* **Trend:** The V100 series is relatively flat and does not exhibit the same upward scaling as the A100.
* **Pattern:** It appears as a dense, rectangular block of data points.
* **Range:**
* **X-Axis Coverage:** The data starts at a hidden size of 10,240 and terminates at 26,624.
* **Y-Axis Coverage:** The throughput is constrained between a floor of approximately 5–10 TFLOP/s and a ceiling of approximately 60–70 TFLOP/s.
* **Density:** The V100 data is highly clustered, suggesting that for this specific workload, the V100 performance is largely independent of the hidden size within the tested range.
### Key Observations
* **Performance Gap:** The A100 significantly outperforms the V100 across all overlapping hidden sizes. Even at the V100's peak performance (~70 TFLOP/s), the A100 is already operating at a higher throughput level for similar hidden sizes.
* **Scaling:** The A100 demonstrates effective scaling with increased hidden size, whereas the V100 hits a performance plateau.
* **Data Gaps:** The V100 data is absent for hidden sizes below 10,240 and above 26,624.
* **Variance:** The "comb" pattern in the A100 data suggests that the throughput is highly sensitive to the specific hidden size value, likely due to memory alignment, tile size optimizations, or kernel execution efficiency on the A100 architecture.
### Interpretation
This chart demonstrates the architectural performance advantage of the NVIDIA A100 (Ampere architecture) over the V100 (Volta architecture) for this specific computational task (likely matrix multiplication or a neural network layer operation).
* **Why it matters:** The A100's ability to scale throughput as the hidden size increases indicates better utilization of its tensor cores and memory bandwidth compared to the V100.
* **Reading between the lines:** The "comb" pattern in the A100 data is a classic indicator of "kernel tuning" or "alignment" issues. The peaks likely represent hidden sizes that are multiples of the GPU's optimal tile size (e.g., multiples of 8, 16, or 32), allowing for maximum occupancy. The troughs represent "misaligned" sizes where the GPU cannot utilize its full parallel processing capability. The V100's dense, flat block suggests it may be hitting a hardware bottleneck (memory bandwidth or compute limit) that prevents it from scaling, regardless of the hidden size.