## Radar Chart: Performance Comparison
### Overview
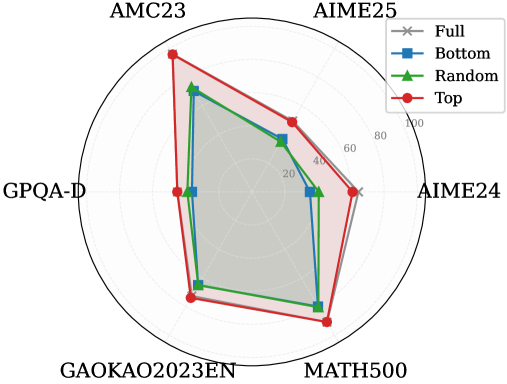
The image is a radar chart comparing the performance of four different methods (Full, Bottom, Random, Top) across six categories: AIME24, AIME25, AMC23, GPQA-D, GAOKAO2023EN, and MATH500. The chart visualizes the relative strengths and weaknesses of each method in each category.
### Components/Axes
* **Axes:** The chart has six radial axes, each representing a category. The categories are:
* AIME24
* AIME25
* AMC23
* GPQA-D
* GAOKAO2023EN
* MATH500
* **Scale:** The radial scale ranges from 0 to 100, with markers at 20, 40, 60, 80, and 100.
* **Legend:** Located in the top-right corner, the legend identifies the four methods:
* Full (Gray line with an 'x' marker)
* Bottom (Blue line with a square marker)
* Random (Green line with a triangle marker)
* Top (Red line with a circle marker)
### Detailed Analysis
Here's a breakdown of the performance of each method in each category:
* **Full (Gray):**
* AIME24: Approximately 28
* AIME25: Approximately 28
* AMC23: Approximately 28
* GPQA-D: Approximately 28
* GAOKAO2023EN: Approximately 28
* MATH500: Approximately 28
* Trend: The "Full" method has a constant value across all categories.
* **Bottom (Blue):**
* AIME24: Approximately 20
* AIME25: Approximately 40
* AMC23: Approximately 80
* GPQA-D: Approximately 30
* GAOKAO2023EN: Approximately 20
* MATH500: Approximately 20
* Trend: The "Bottom" method shows variability, peaking at AMC23.
* **Random (Green):**
* AIME24: Approximately 25
* AIME25: Approximately 45
* AMC23: Approximately 75
* GPQA-D: Approximately 35
* GAOKAO2023EN: Approximately 25
* MATH500: Approximately 25
* Trend: The "Random" method shows variability, peaking at AMC23.
* **Top (Red):**
* AIME24: Approximately 30
* AIME25: Approximately 95
* AMC23: Approximately 95
* GPQA-D: Approximately 20
* GAOKAO2023EN: Approximately 10
* MATH500: Approximately 10
* Trend: The "Top" method shows significant variability, with high values for AIME25 and AMC23, and low values for GAOKAO2023EN and MATH500.
### Key Observations
* The "Full" method has a constant value across all categories.
* The "Top" method performs exceptionally well in AIME25 and AMC23 but poorly in GAOKAO2023EN and MATH500.
* The "Bottom" and "Random" methods show similar trends, with a peak in AMC23.
### Interpretation
The radar chart provides a clear visualization of the strengths and weaknesses of each method across different categories. The "Top" method appears to be highly specialized, excelling in some areas but failing in others. The "Full" method provides a baseline performance across all categories. The "Bottom" and "Random" methods offer intermediate performance, with a notable strength in AMC23. The choice of method would depend on the specific requirements and priorities of the task.