## Line Graph: Power and Clock Frequency Over Time
### Overview
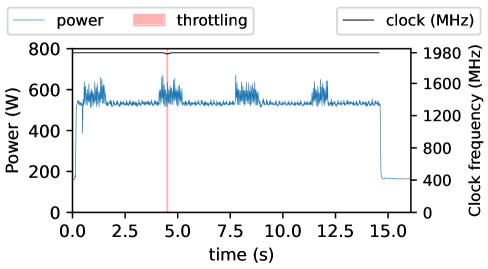
The image is a line graph depicting two time-series data sets: **power consumption (W)** and **clock frequency (MHz)** over a 15-second interval. A vertical red line marks a "throttling" event at approximately 5.0 seconds. The graph includes a legend, dual y-axes, and a secondary x-axis for time.
---
### Components/Axes
- **X-axis (Time)**: Labeled "time (s)" with markers at 0.0, 2.5, 5.0, 7.5, 10.0, 12.5, and 15.0 seconds.
- **Left Y-axis (Power)**: Labeled "Power (W)" with values ranging from 0 to 800 W.
- **Right Y-axis (Clock Frequency)**: Labeled "Clock frequency (MHz)" with values ranging from 0 to 1980 MHz.
- **Legend**: Located in the top-left corner, with:
- **Blue line**: "power"
- **Red vertical line**: "throttling"
- **Black dashed line**: "clock (MHz)"
- **Secondary X-axis**: Not explicitly labeled but implied by the time markers.
---
### Detailed Analysis
1. **Power (Blue Line)**:
- **Initial Drop**: Power plunges from ~800 W to ~400 W at ~0.5 seconds.
- **Stable Phase**: Fluctuates between ~500–700 W from ~0.5s to ~15s, with periodic spikes (e.g., ~600 W at ~2.5s, ~700 W at ~7.5s).
- **Final Drop**: Sharp decline to ~200 W at ~15s.
2. **Clock Frequency (Black Dashed Line)**:
- **Initial Drop**: Drops from ~1980 MHz to ~1600 MHz at ~0.5 seconds.
- **Stable Phase**: Remains near ~1600 MHz until ~15s.
- **Final Drop**: Plummets to ~400 MHz at ~15s.
3. **Throttling Marker (Red Vertical Line)**:
- Positioned at ~5.0 seconds, coinciding with a power spike (~700 W) and a clock frequency plateau (~1600 MHz).
---
### Key Observations
- **Power and Clock Correlation**: Both metrics drop sharply at ~0.5s, suggesting a system response to workload or thermal constraints.
- **Throttling Timing**: The throttling marker at 5.0s occurs during a power spike, implying throttling may be triggered by sustained high power.
- **Final Drop**: The abrupt decline in both metrics at 15s suggests a system shutdown or critical failure.
- **Periodic Spikes**: Power spikes at ~2.5s and ~7.5s may indicate recurring tasks or workload bursts.
---
### Interpretation
- **System Behavior**: The graph likely represents a computational workload with dynamic power and clock management. The initial drop at 0.5s could reflect a transition to a lower-power state (e.g., sleep mode), while the throttling at 5.0s indicates thermal or power limits being enforced.
- **Anomalies**: The final drop at 15s is abrupt and unexplained by prior trends, possibly signaling a hardware failure or intentional shutdown.
- **Throttling Mechanism**: The correlation between power spikes and throttling suggests the system reduces clock frequency to manage thermal/power constraints, though the throttling marker at 5.0s occurs after the initial power drop, raising questions about trigger timing.
---
### Uncertainties
- Exact timing of the throttling event (5.0s) may have ±0.1s uncertainty due to visual estimation.
- Power spikes (e.g., ~700 W) are approximate, as the graph lacks gridlines for precise interpolation.
- The cause of the final drop at 15s is not explicitly stated in the data.